Redis Monitoring
Redis Monitoring
ZoomPhant provides a straightforward way to monitor Redis servers or clusters using the Redis plugin.
Creating a Redis Monitoring Service
To start monitoring a Redis server, choose the Redis plugin as described in Add Monitor Service and specify the following parameters:
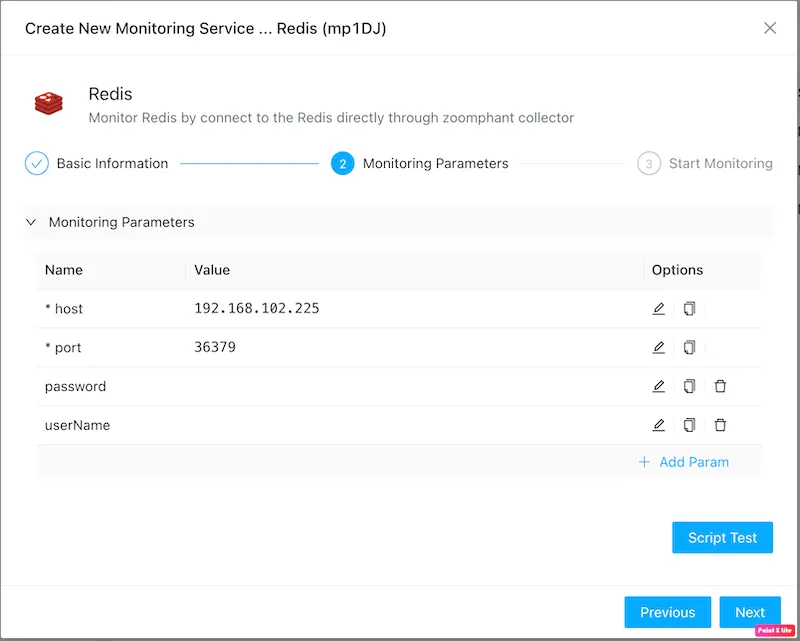
- host: The hostname or IP address of the Redis server.
- port: The port number of the Redis server (e.g.,
6379). - password: (Optional) The password required for Redis authentication.
- userName: (Optional) The username required for Redis authentication (useful for Redis 6.0 ACLs).
Once the parameters are set and the monitoring service is created, wait a few seconds for data collection to initialize, and the dashboards will begin displaying metrics.
Understanding Redis Data
ZoomPhant organizes Redis performance metrics into an intuitive dashboard layout:
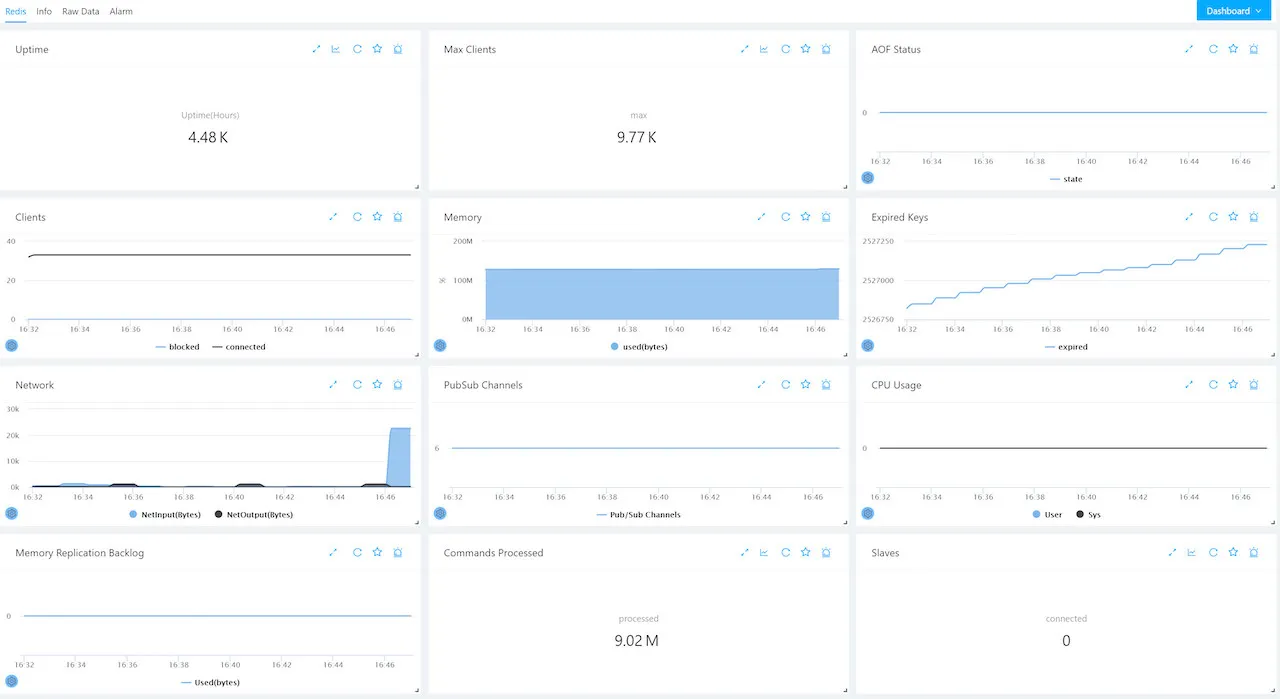
This dashboard includes the following metrics:
- Uptime (in hours).
- Maximum configured clients.
- Append Only File (AOF) status.
- Connected and blocked clients.
- Used memory.
- Expired keys count.
- Input and output network throughput (bytes/sec).
- Publish/Subscribe channels.
- User and System CPU usage.
- Replication backlog memory size.
- Total commands processed.
- Number of connected replicas.