ProxmoxVE Monitoring
Proxmox VE (PVE) is a popular open-source virtualization platform. Similar to VMware ESXi monitoring, ZoomPhant provides comprehensive, native monitoring for Proxmox VE cluster health and resource usage.
For more information about PVE, please visit the official website at Proxmox VE.
Creating a Proxmox VE Monitoring Service
Before creating a Proxmox VE monitoring service, collect the following connection details:
- Cluster Access Endpoint: The URL used to access the PVE administration panel (e.g.,
https://192.168.1.1:8006). - Username: The account name configured for monitoring (e.g.,
monitororzervice). Include the authentication realm (domain), which defaults topam(e.g.,monitor@pam). - Password or API Token: If using an API token, format it as
tokenId=tokenValue. For example, if you created a token with the IDmonitoringand the valuea267354d-bc9f-426a-828c-5174382b3e00, you must entermonitoring=a267354d-bc9f-426a-828c-5174382b3e00in the token field.
Once you have this information, you can add the service. Follow the steps in Add Monitor Service and select the Proxmox plugin:
In the parameters step, fill in the configuration fields:
- url: Enter either the host IP and port (e.g.,
192.168.1.1:8006) or the full URL (e.g.,https://192.168.1.1:8006/). - username: The monitoring account name.
- password: The account password. If you are using an API token instead, leave this blank.
- token: The API token formatted as
tokenId=tokenValue. Leave this blank if using a password.
Click Finish to complete the wizard. After a few seconds, data will begin reporting to ZoomPhant.
Understanding Proxmox Data
The Proxmox VE monitoring dashboard provides an overview of cluster health, individual node statistics, and guest VM performance.
Cluster Dashboard
The landing view is the cluster-level dashboard:
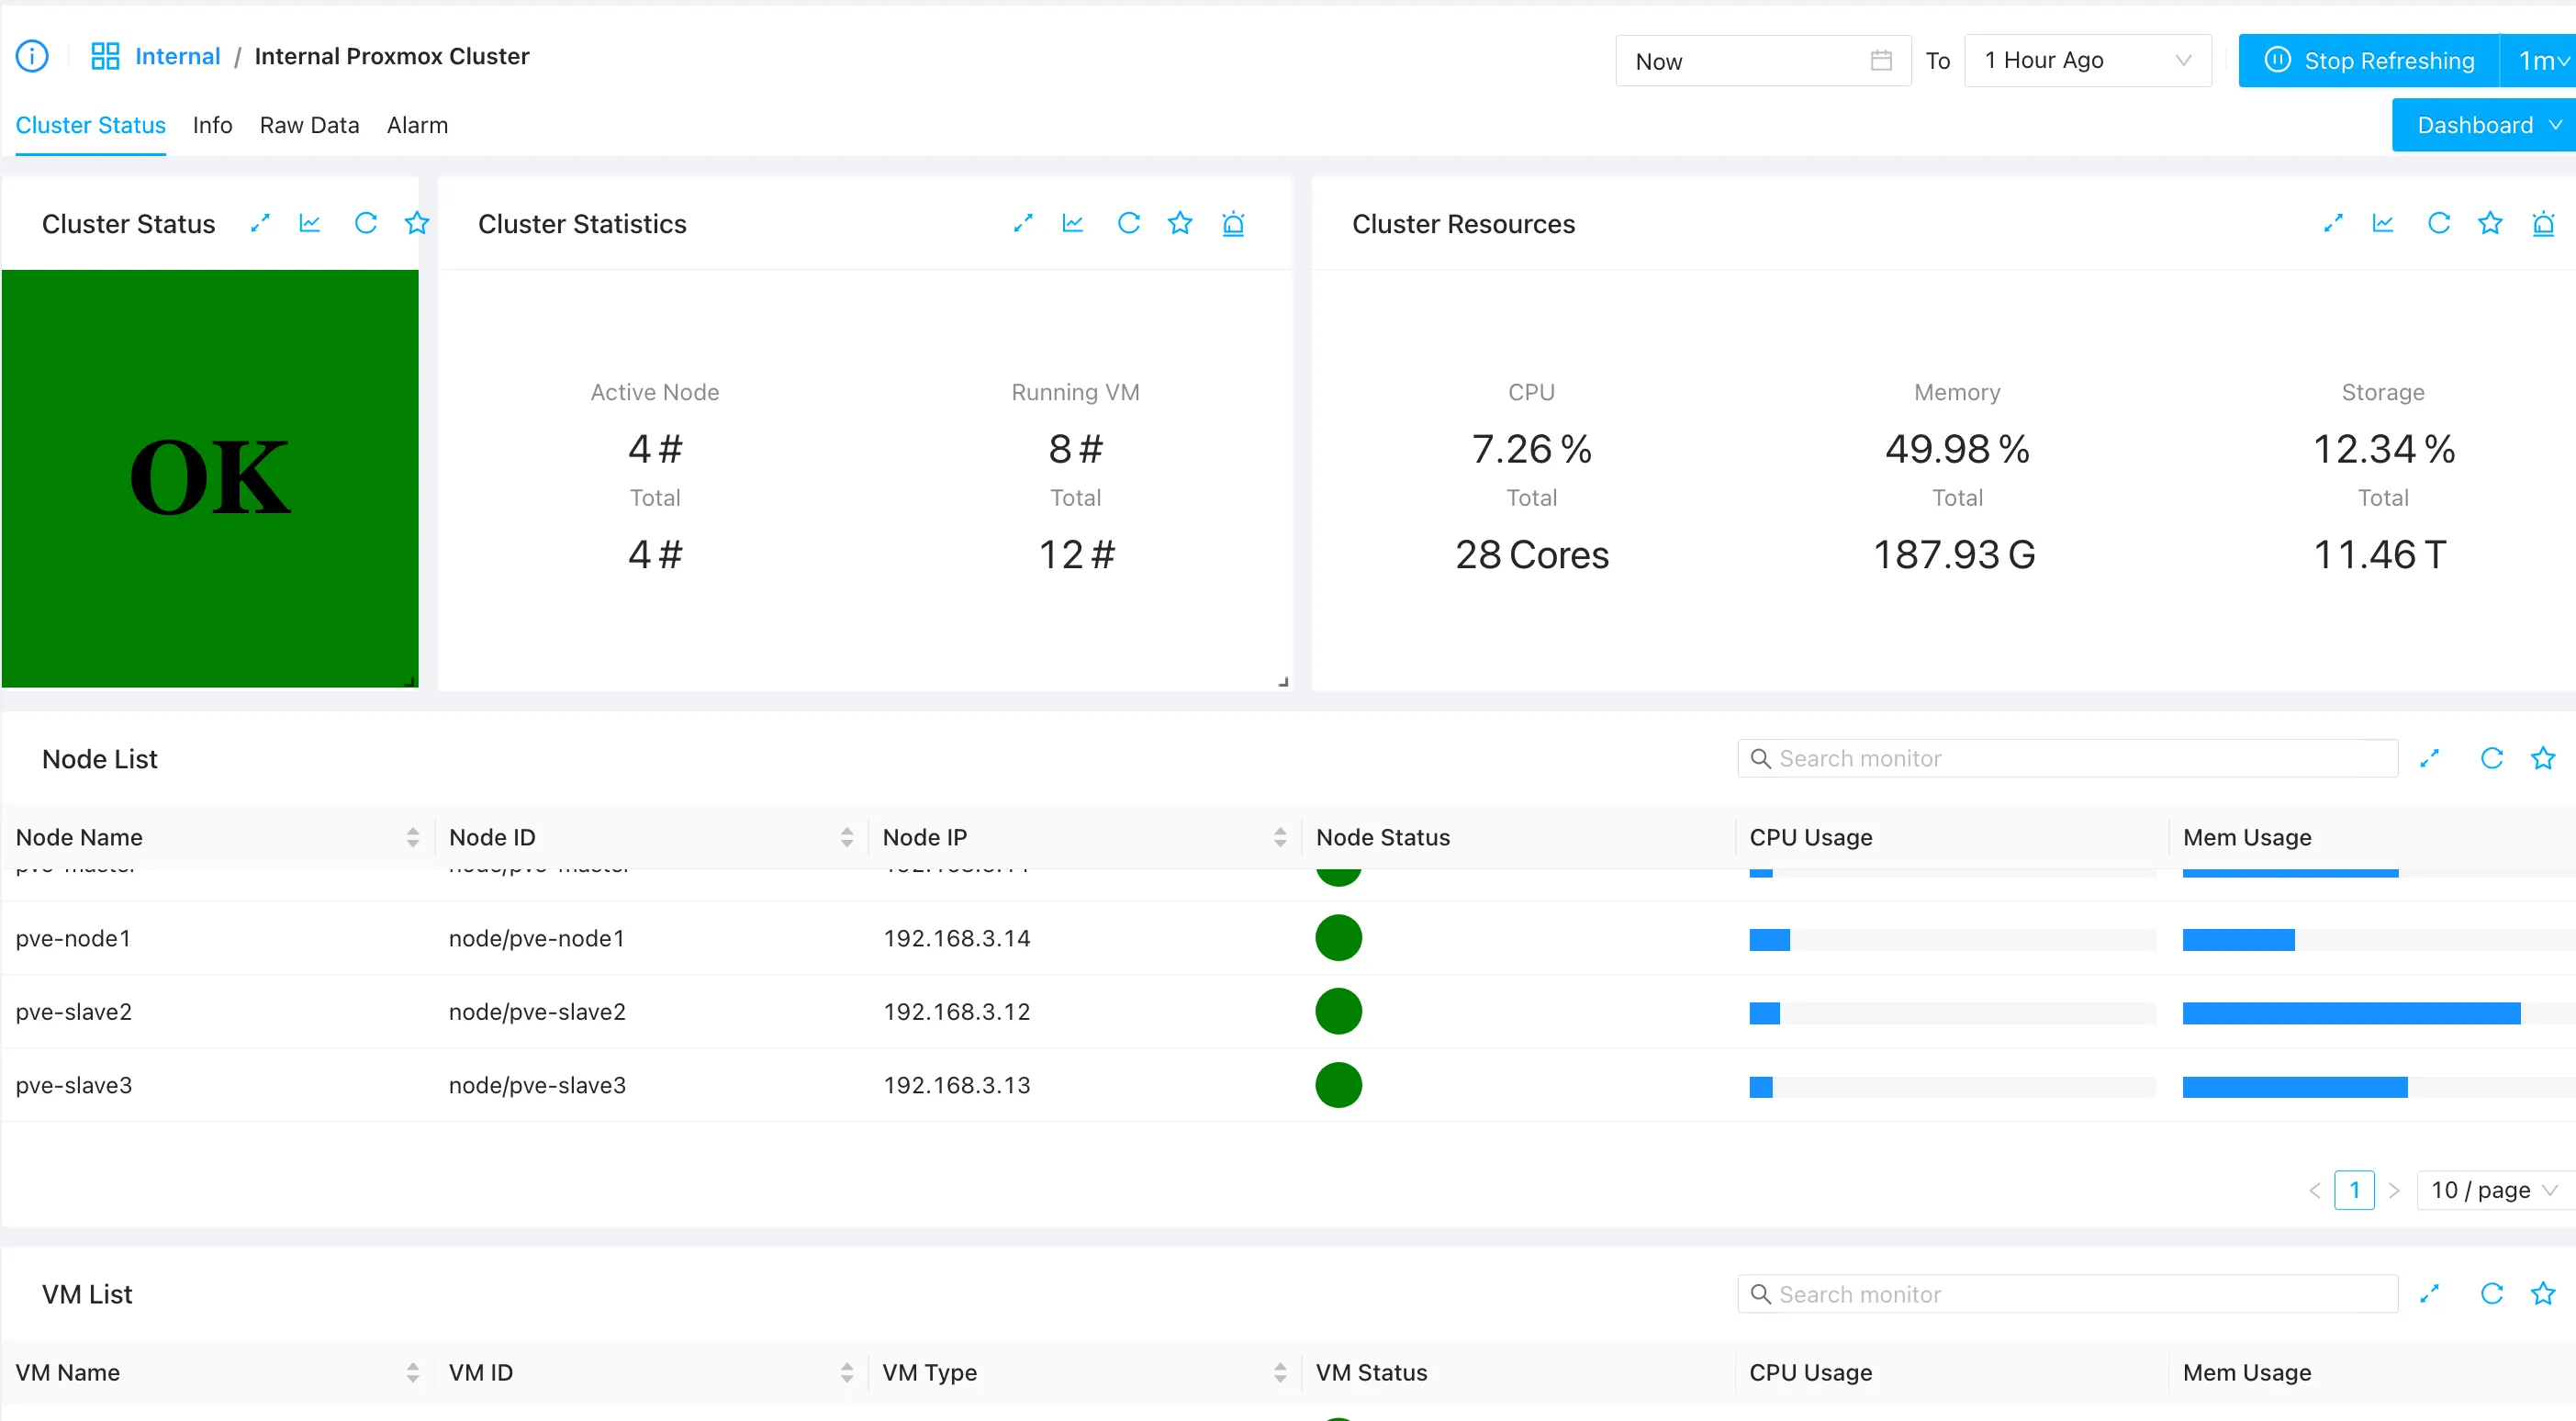
This dashboard contains:
- Cluster statistics (number of nodes, VMs, etc.).
- Aggregated cluster resource usage (CPU, memory, storage).
- A list of nodes with status indicators.
- A list of guest VMs with status indicators.
The nodes and VMs listed are interactive. Click any row to navigate directly to its specific detail dashboard.
Node Dashboard
Clicking a node in the node list opens the node-specific dashboard:
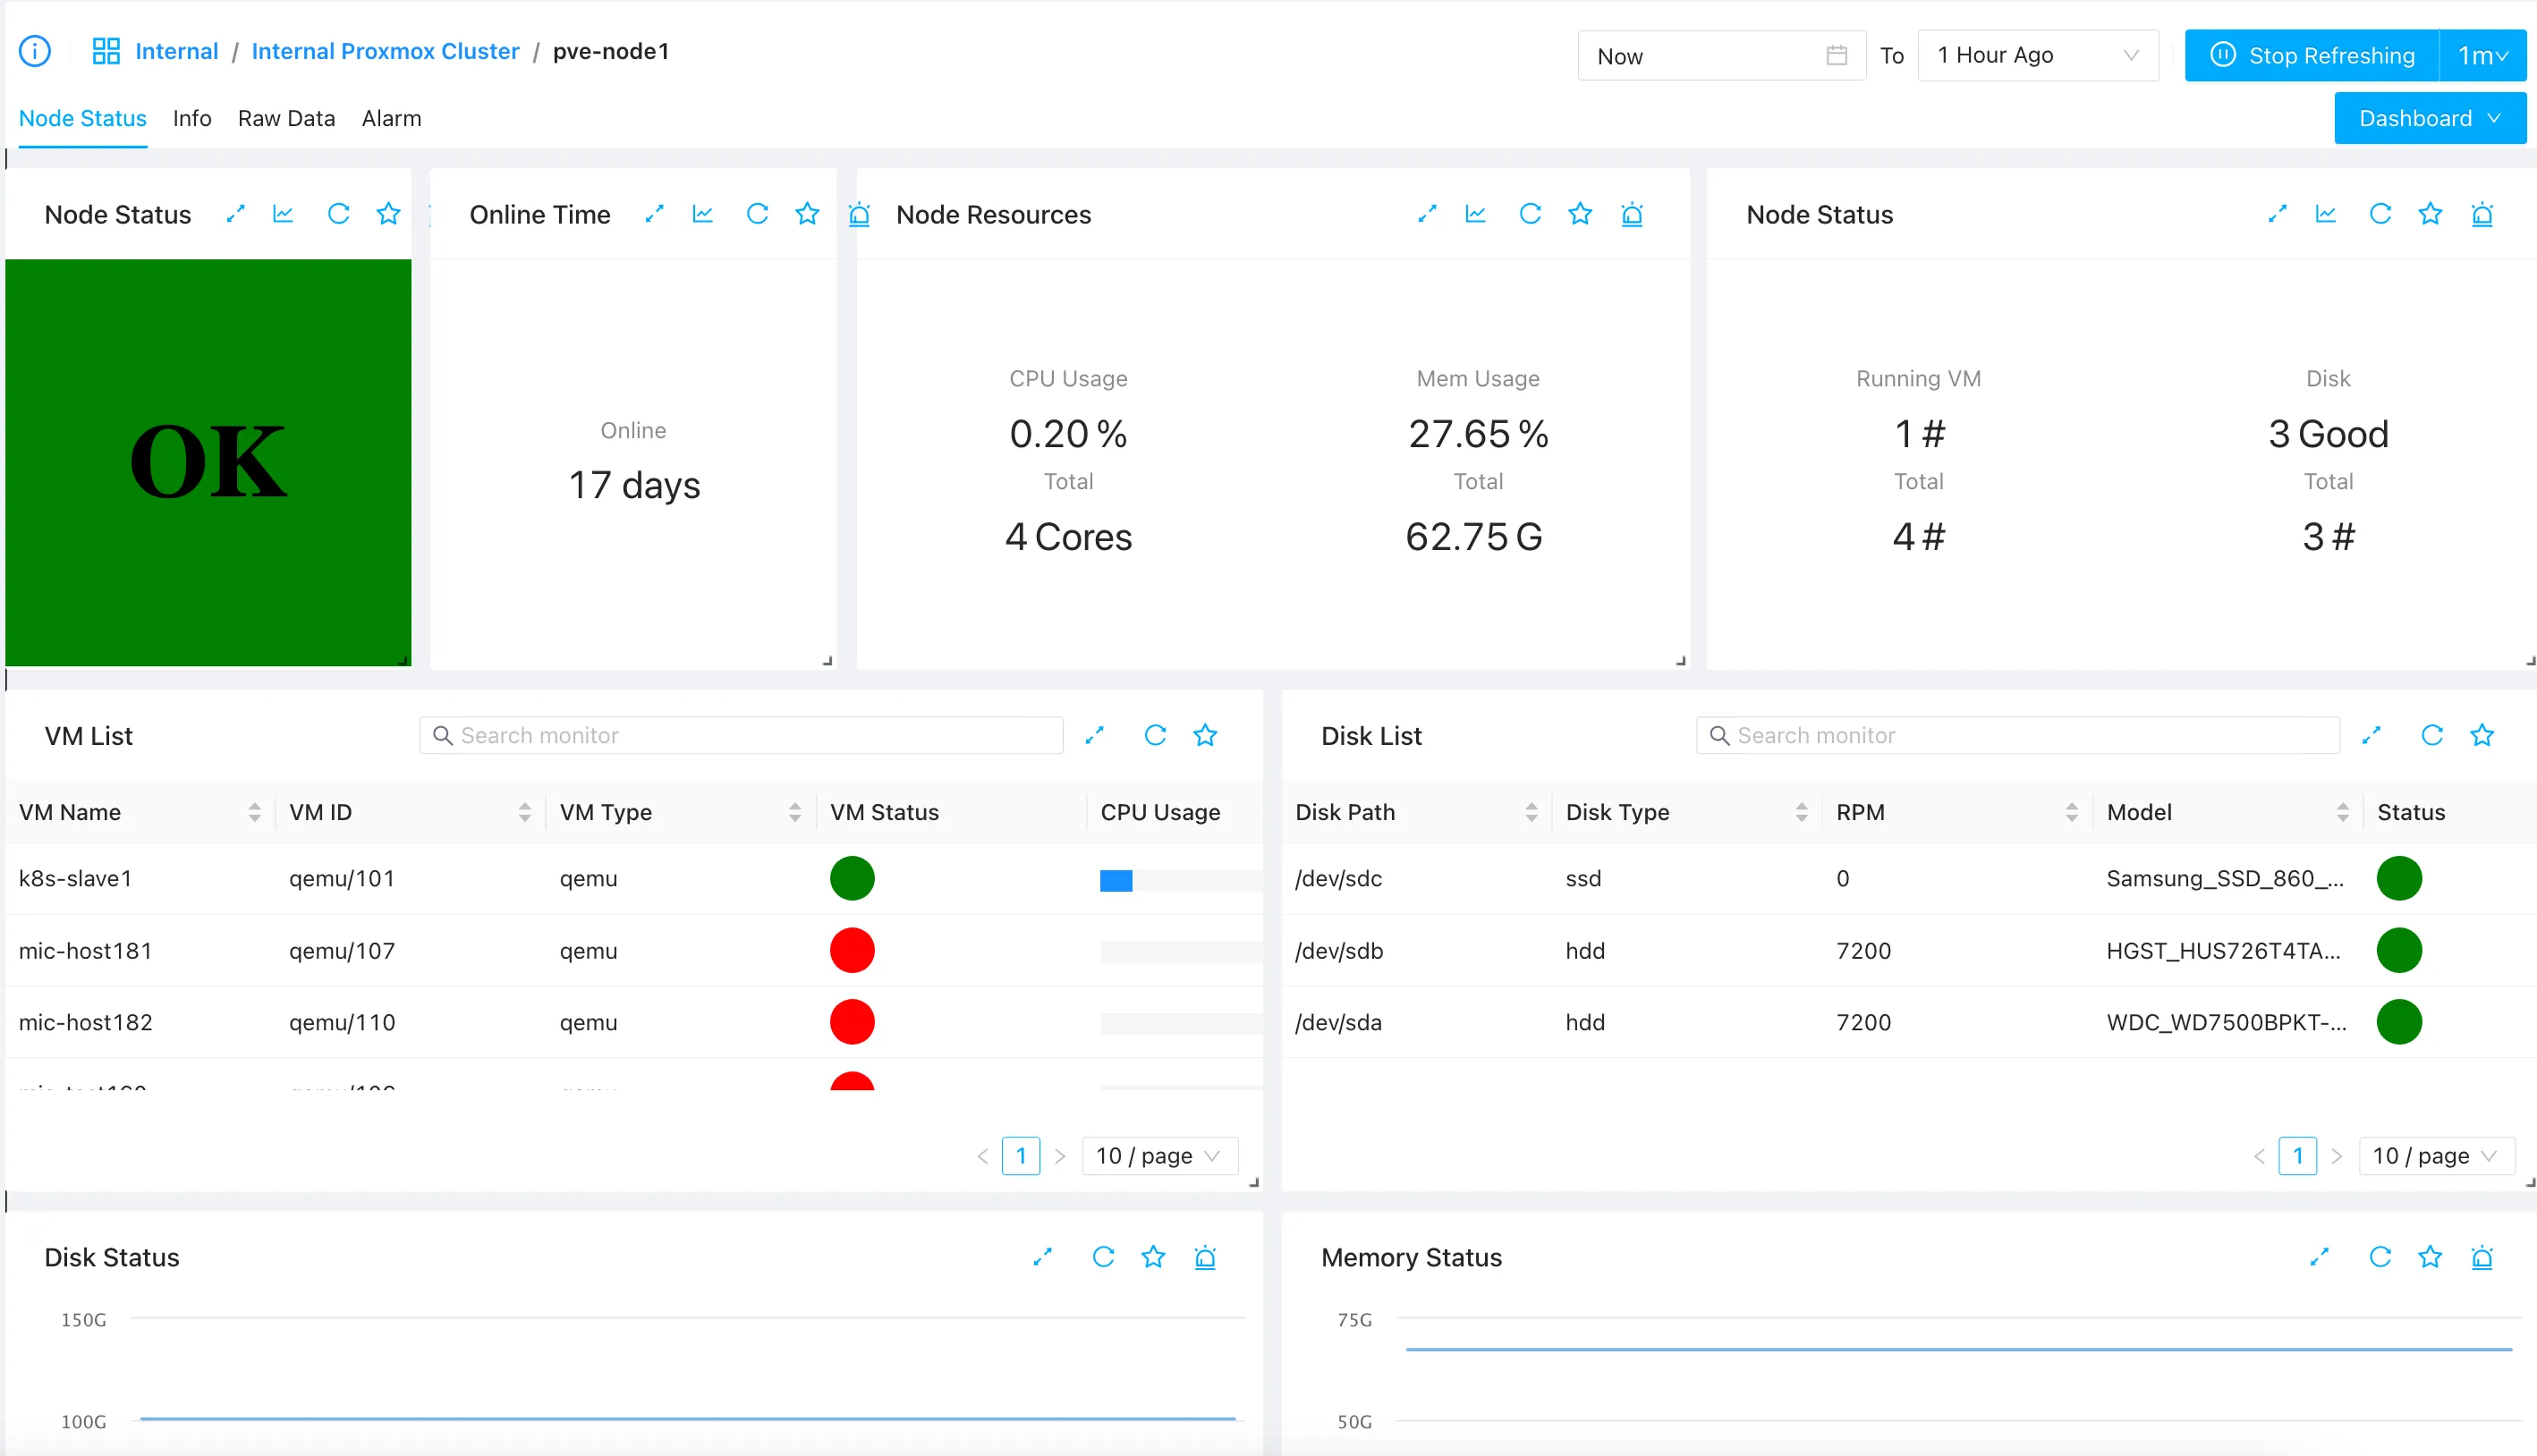
This dashboard includes:
- Node uptime.
- Detailed resource utilization (CPU, memory, disk, network).
- A list of guest VMs running on this specific node.
- Node storage and disk status.
As with the cluster dashboard, clicking any VM in the list will navigate you to its dedicated VM dashboard.
VM Dashboard
Clicking a VM in the Cluster Dashboard or Node Dashboard opens the VM-specific dashboard:
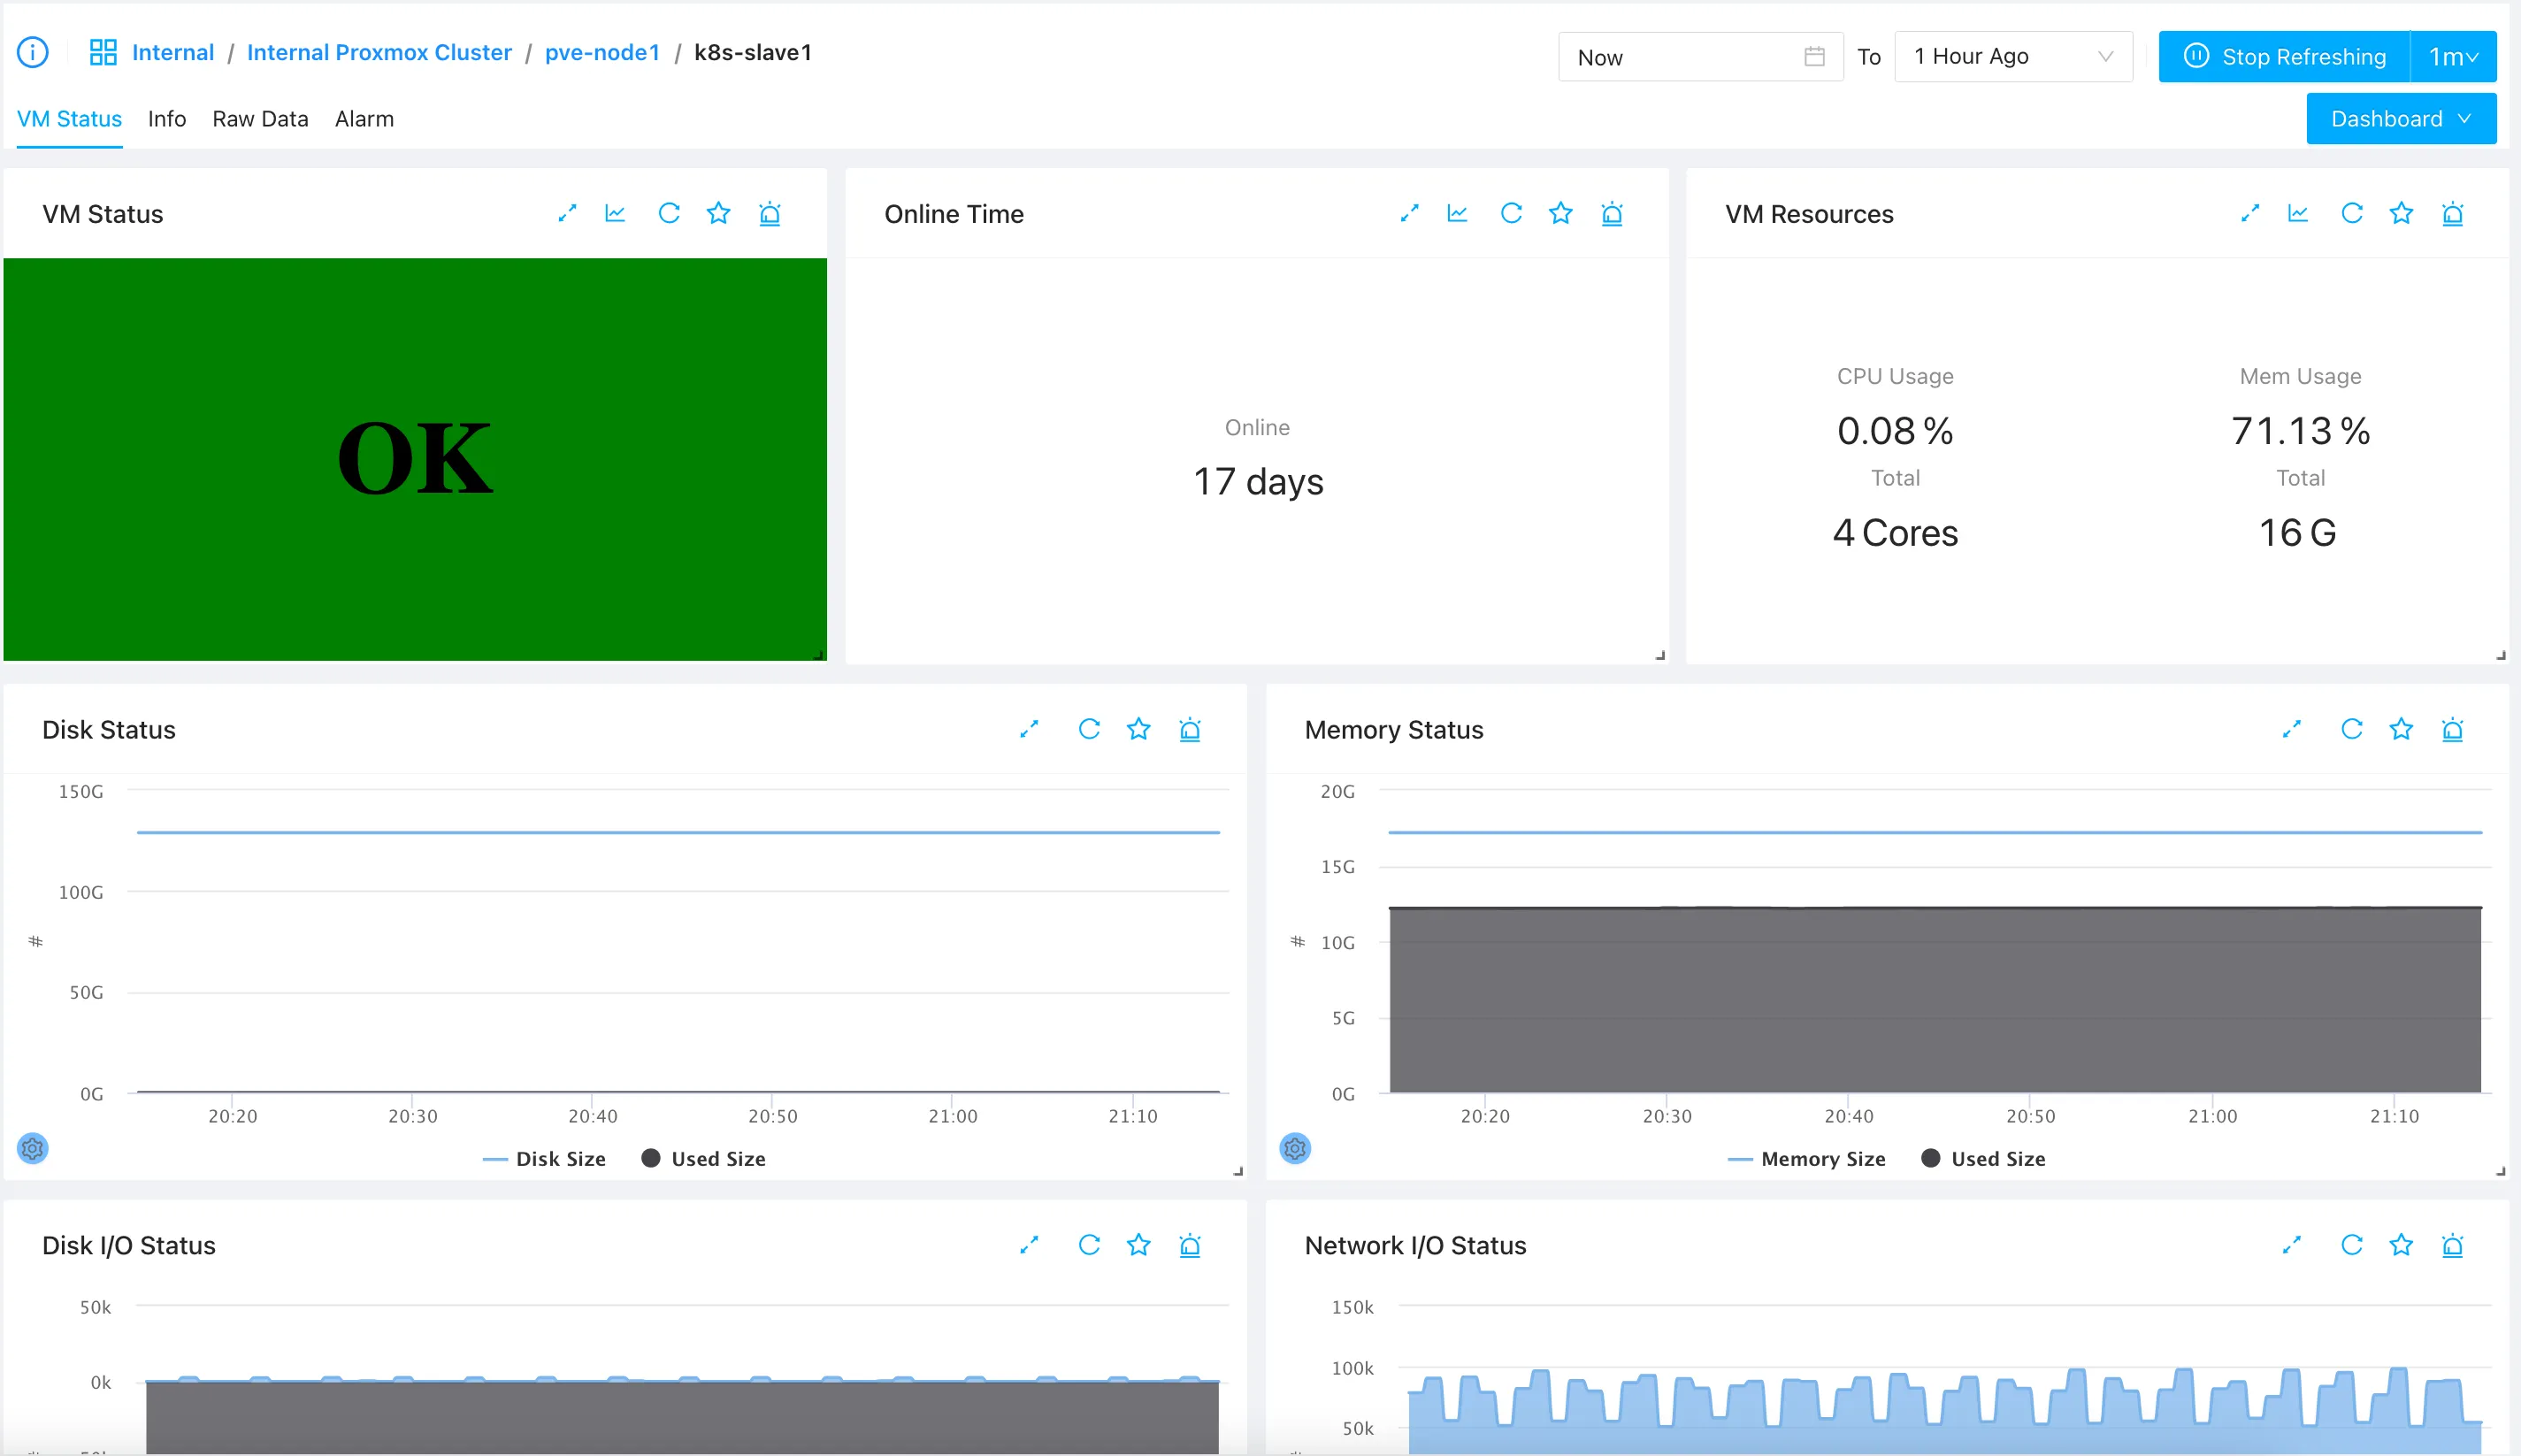
This view provides:
- VM status and uptime.
- Detailed resource consumption.
- Disk I/O and Network interface traffic.
- General VM metadata.