Dashboards
Dashboards
Dashboards play a pivotal role in monitoring systems, providing users with a visual interface to effectively monitor, analyze, and manage their IT infrastructure. In ZoomPhant, dashboards are categorized into three levels: global, service, and independent, each serving specific purposes tailored to your needs.
Importance of Dashboards in Monitoring Systems
- Overview of System Health:
- Dashboards offer a comprehensive overview of system health and performance metrics, allowing users to quickly identify trends, anomalies, and potential issues across their entire infrastructure.
- Real-time Monitoring:
- Dashboards provide real-time visibility into Key Performance Indicators (KPIs), enabling users to monitor critical metrics and respond promptly to changes or incidents as they occur.
- Data Visualization:
- Dashboards utilize advanced data visualization techniques to present complex information in an easy-to-understand format, enabling users to gain insights at a glance and make informed decisions.
- Customization and Flexibility:
- Dashboards can be customized to meet the specific needs of users and organizations, allowing them to tailor the layout, content, and metrics displayed based on their preferences and priorities.
Types of Dashboards in ZoomPhant
1. Global Dashboard
The global dashboard provides a centralized view of the entire system on a single page, allowing users to monitor and manage multiple services and components across their infrastructure from one location.
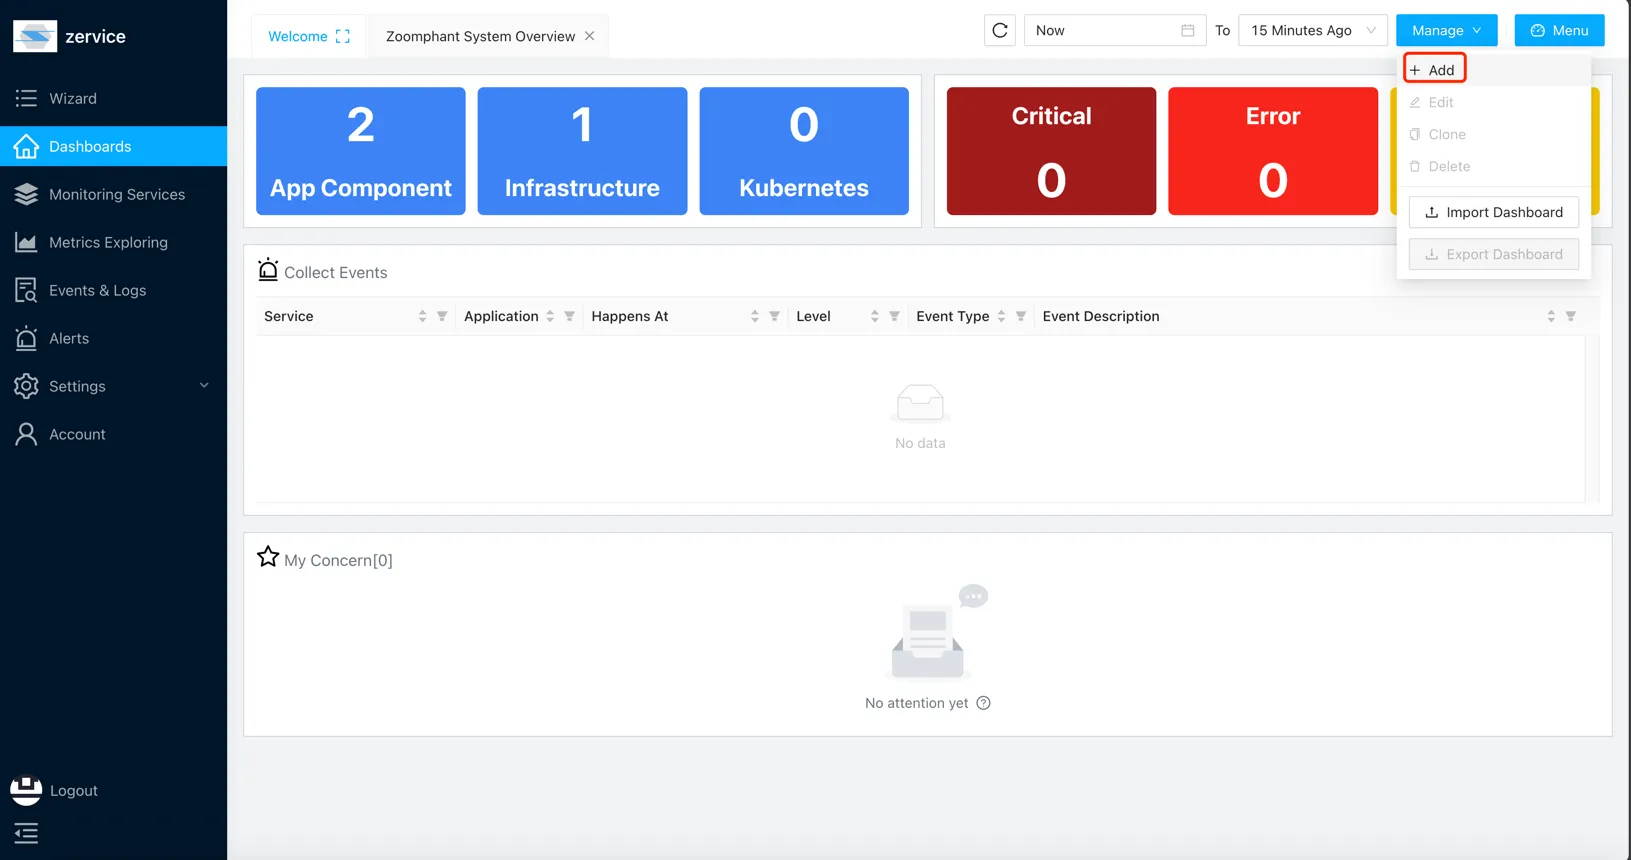
- To create a new global dashboard, click Dashboard > Manage > Add.
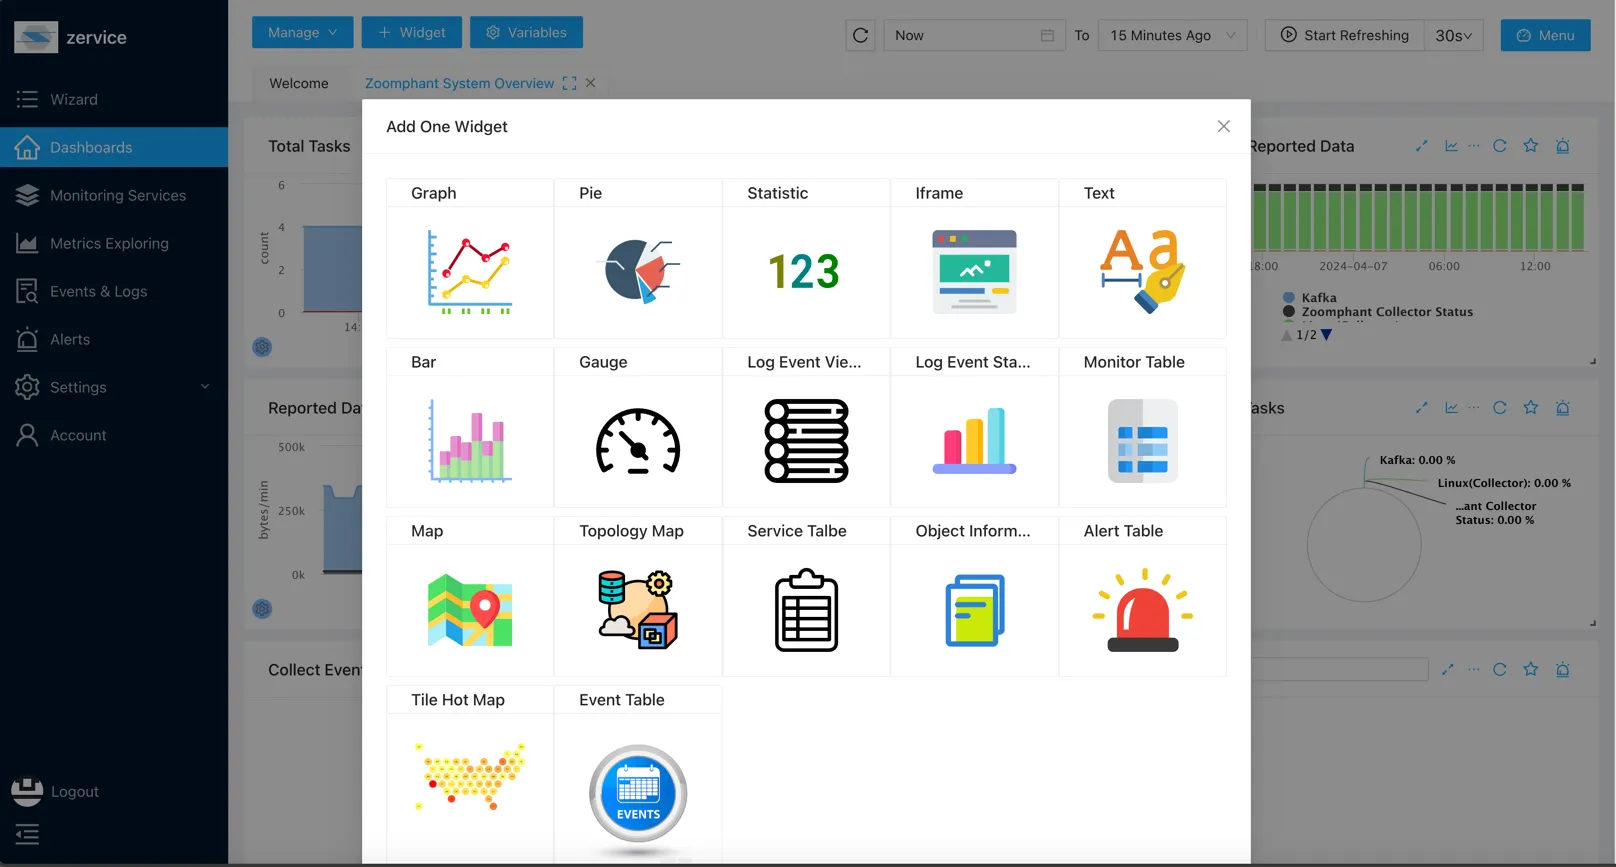
- In a custom dashboard, you can add widgets by clicking the + Widget icon in the top-left corner of the screen.
2. Service-Level Dashboard
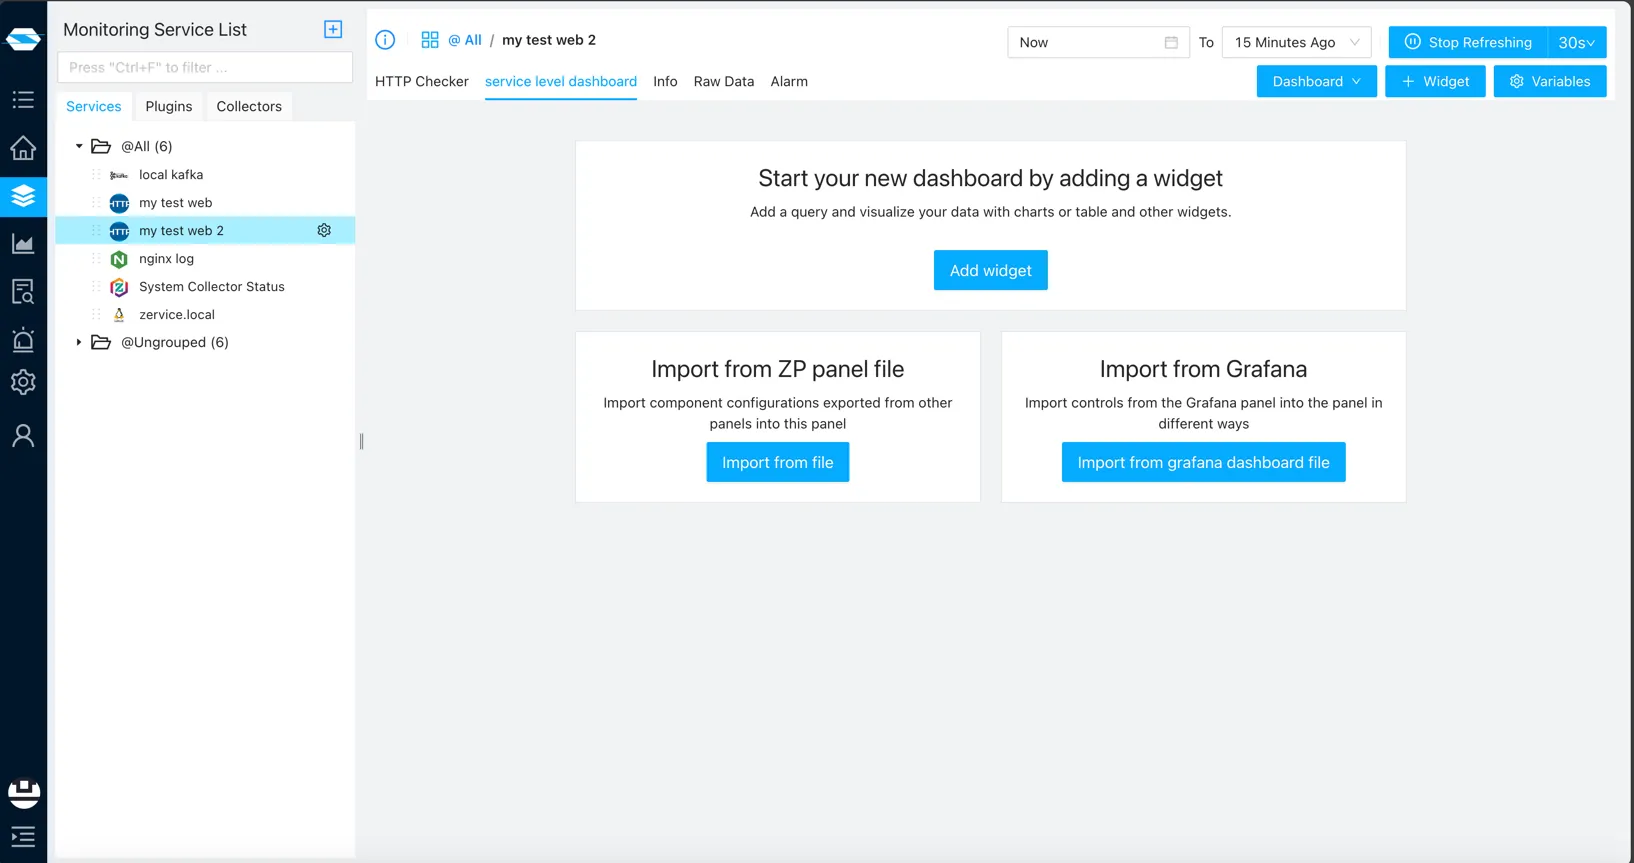
Service-level dashboards are specific to individual services or components within your infrastructure. Once created, a service-level dashboard is accessible across all instances of the same service type, providing consistent monitoring and analysis capabilities.
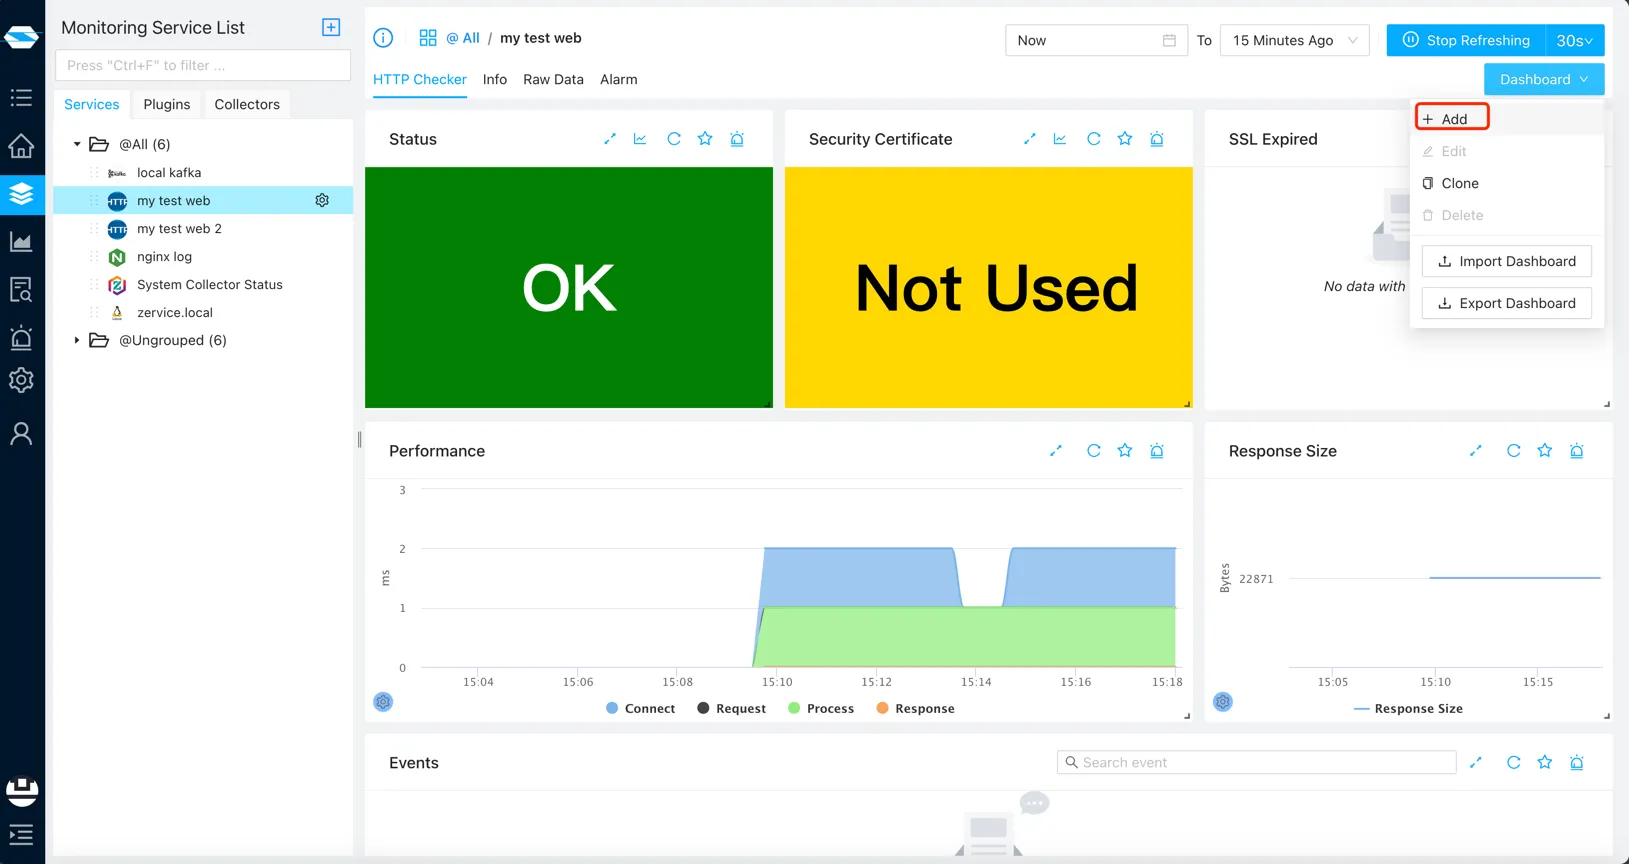
- Click Dashboard > Add on a service page to create a dashboard.
- If the toggle is set to Service, it will be a service-level dashboard.
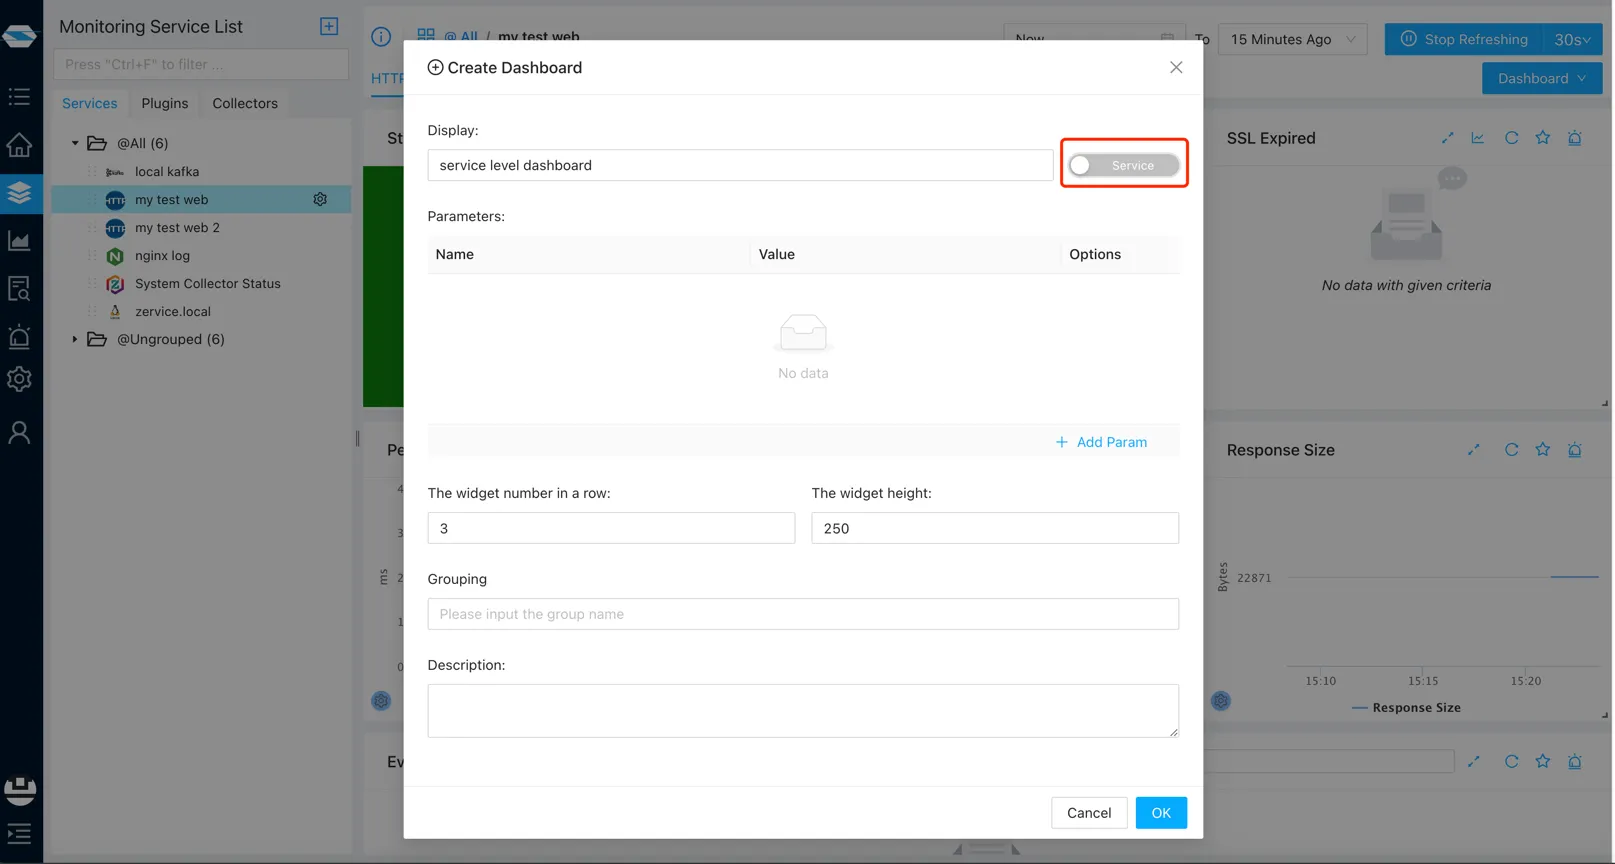
- You can see this dashboard on the current service page, as well as on all other services of the same type.
3. Independent Dashboard
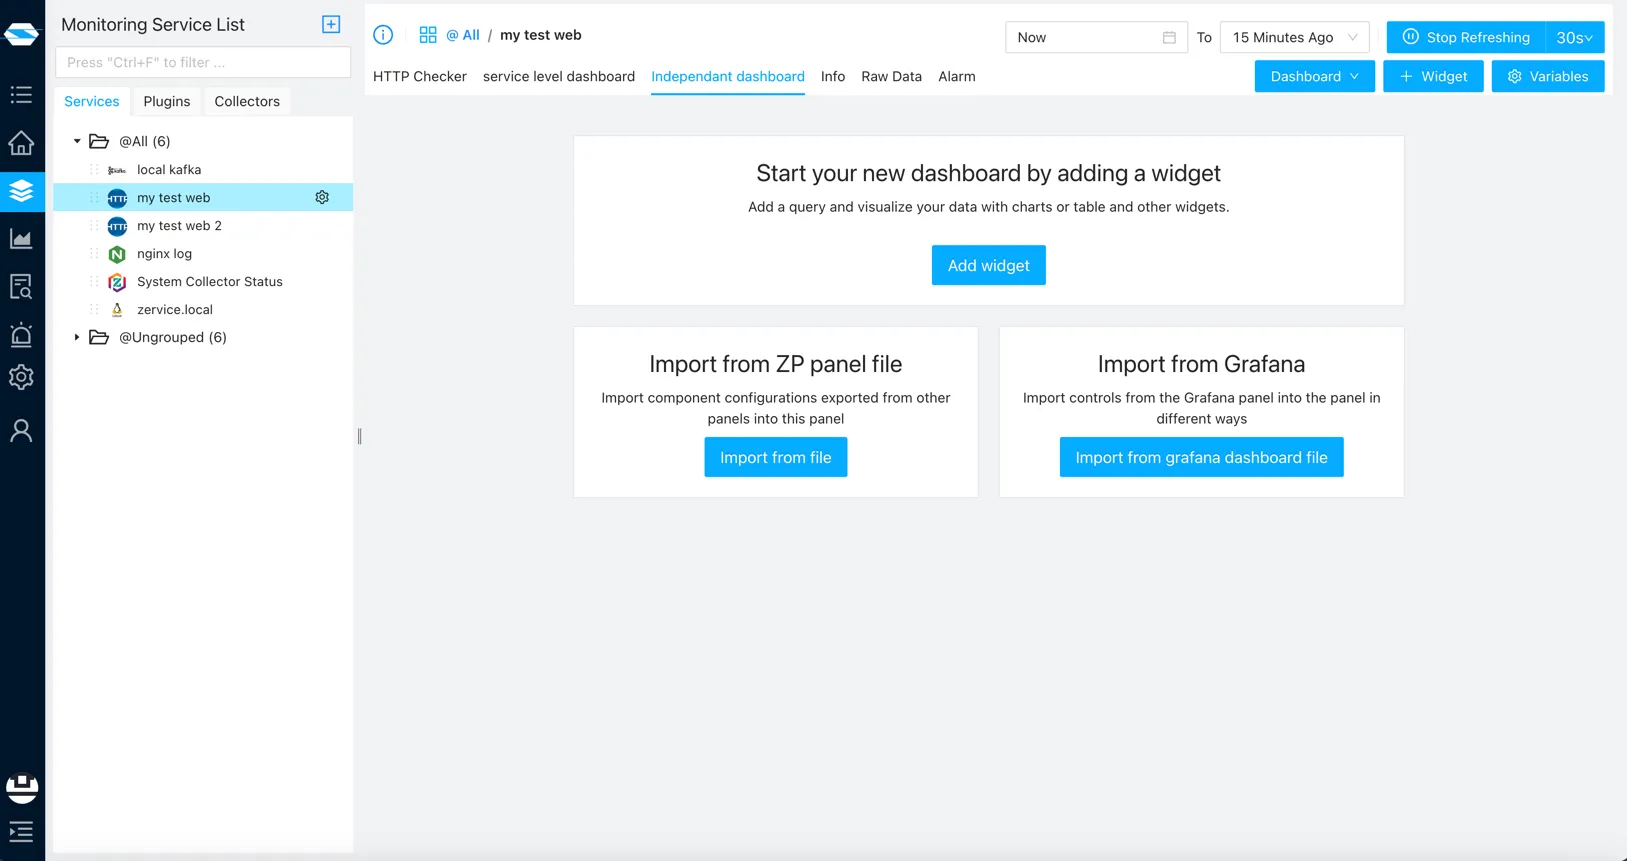
Independent dashboards are unique to the specific service or component they are created for and are not shared with other instances of the same service. They offer focused monitoring and analysis tailored to the specific requirements of that service instance.
- Click Dashboard > Add on a service page to create a dashboard.
- If the toggle is set to Current, it will be an independent dashboard.
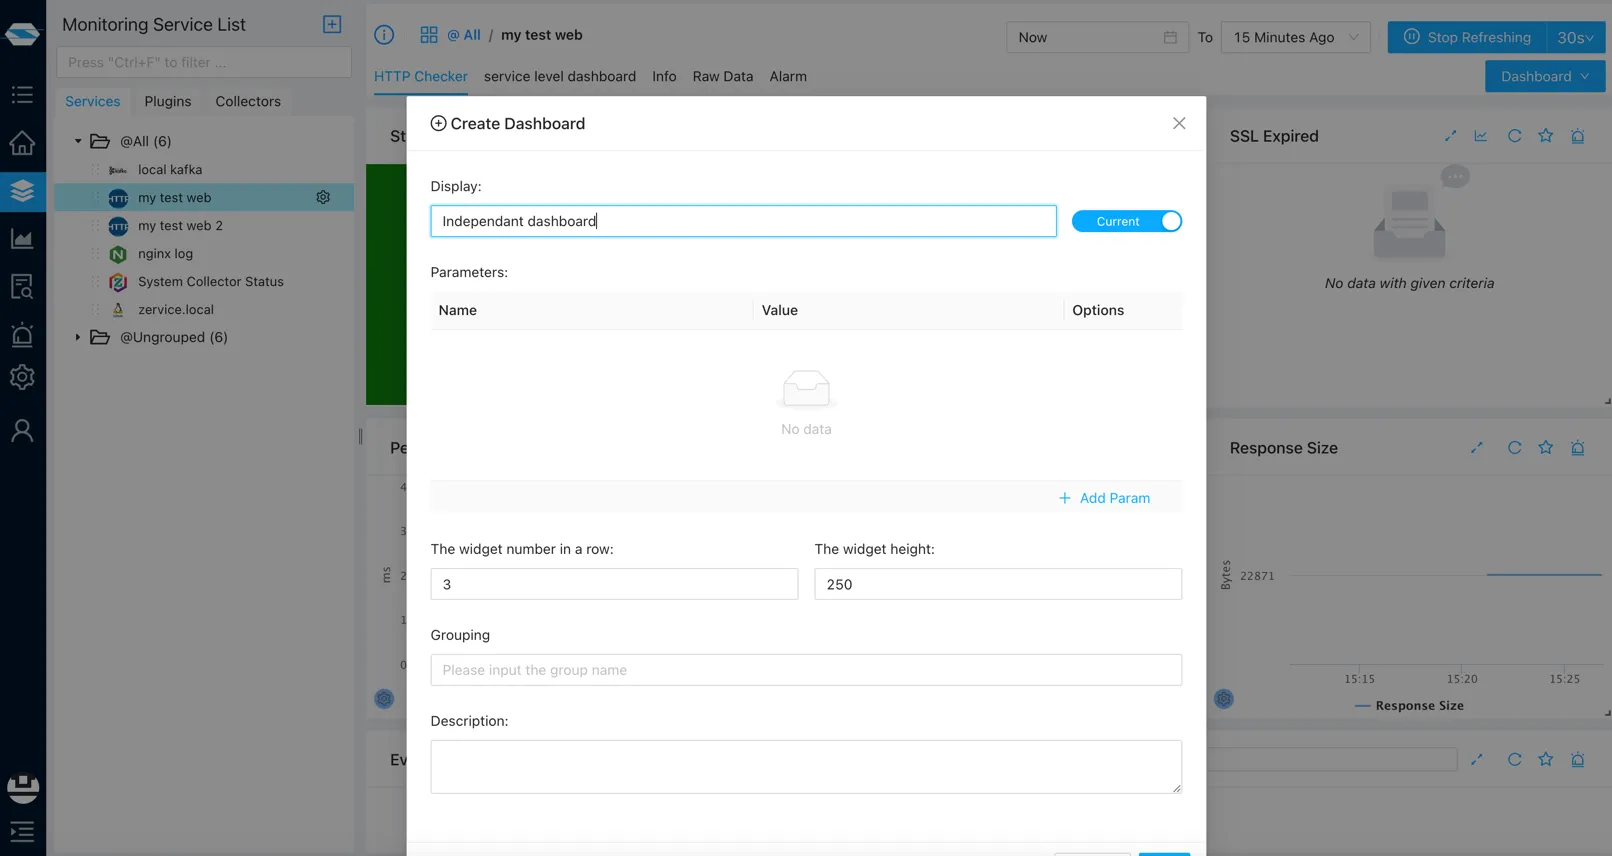
- You can only see the dashboard on this specific service page.
Understanding Widgets in ZoomPhant Dashboards
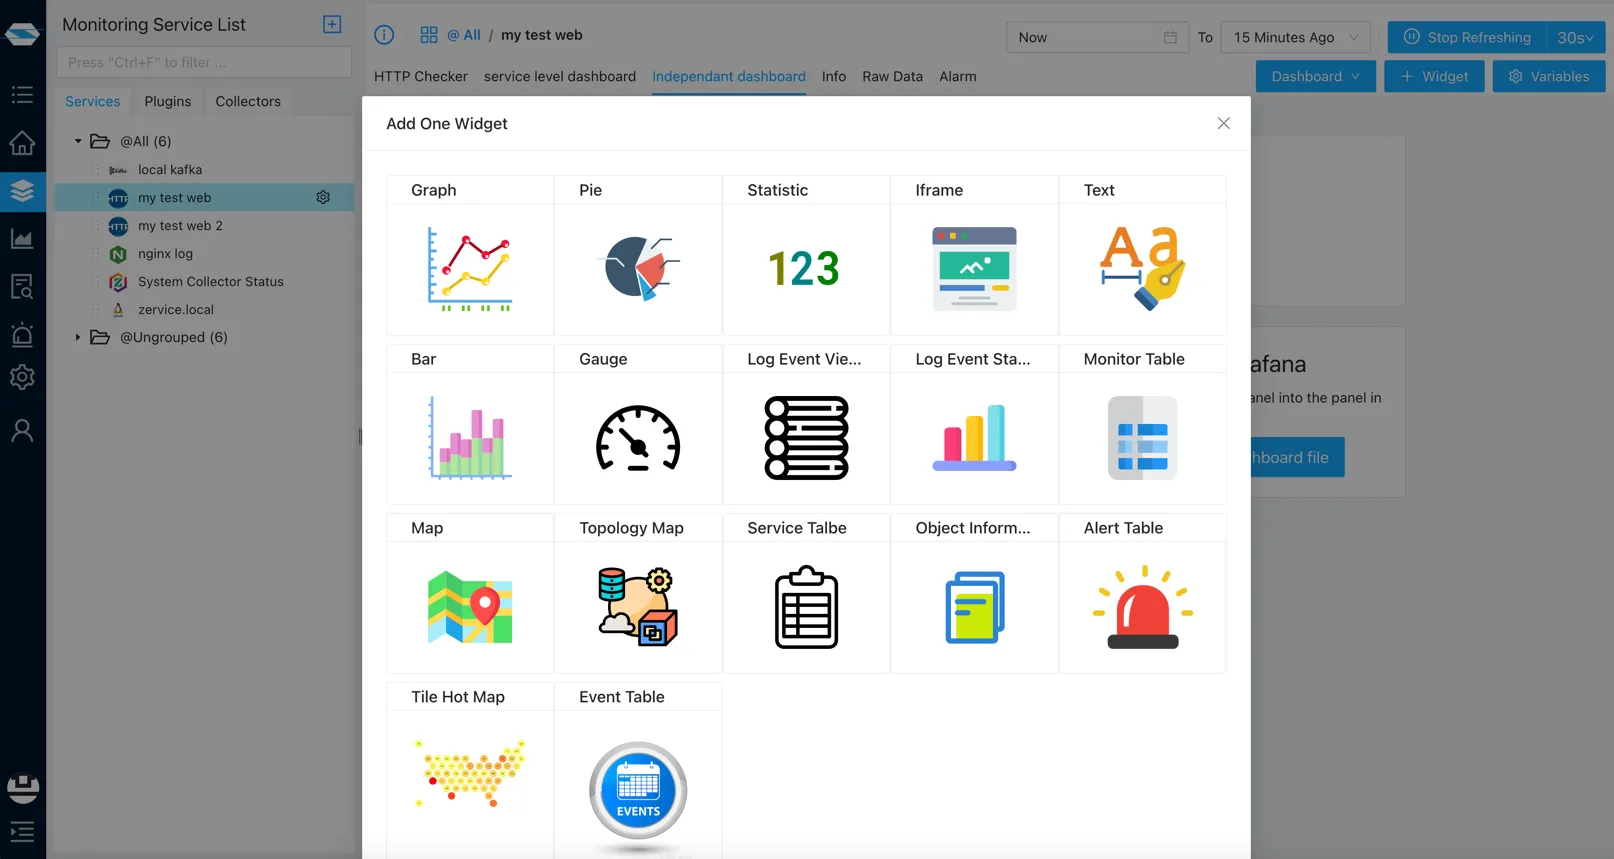
Widgets are the building blocks of dashboards in ZoomPhant, allowing users to visualize and analyze monitoring data in various formats.
When editing a custom dashboard, you can add widgets by clicking the Add Widget icon.
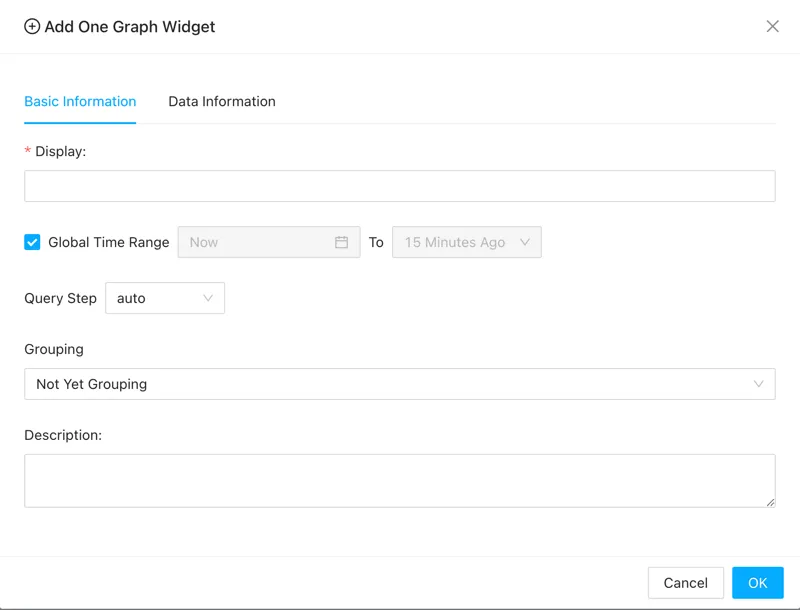
All widgets contain two configuration tabs:
-
Basic Information:
- Display: The name of the widget.
- Global Time Range: When enabled, the widget’s time range follows the global dashboard time range.
- Query Step: The time interval between consecutive data points.
- Grouping: Set the grouping parameters for the dashboard query.
- Description: An optional description of the widget’s purpose.
-
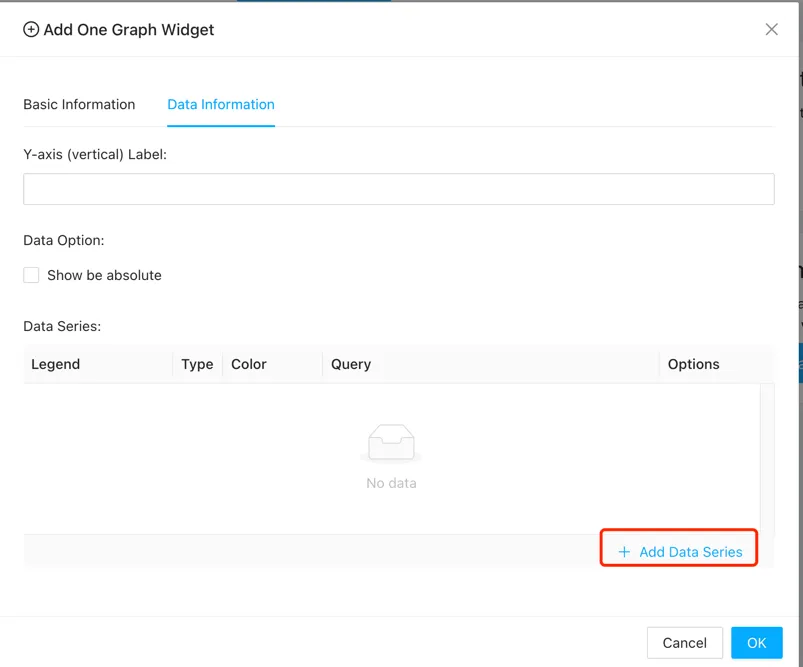
Data Information: Different widgets require different data configurations. Almost all widgets require you to click Add Data Series to begin.
Graph Widget
Displays time-series data in line, area, or bar charts, allowing users to track trends and patterns over time.
- You can set the Y-axis label or click the Add Data Series button.
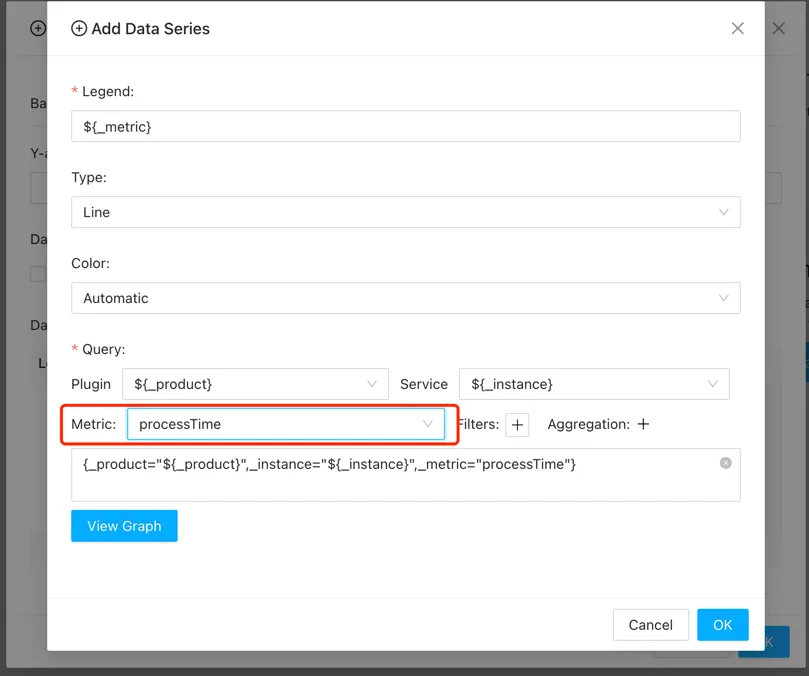
- When adding a data series, you typically only need to select the metric. If you are familiar with our data query syntax, you can also use advanced query features.
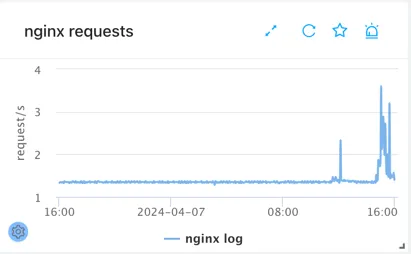
- The completed widget looks like this:
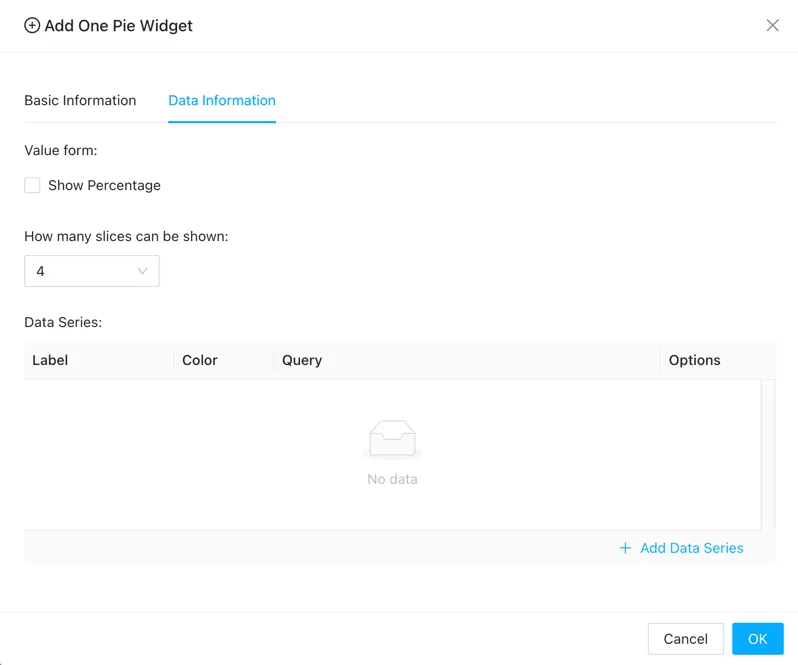
Pie Widget
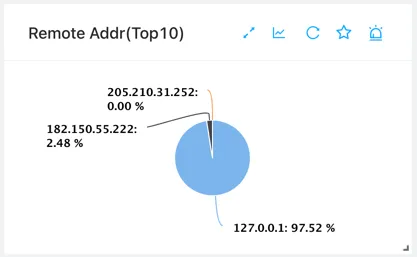
Represents data in a circular graph, illustrating the distribution of values as proportions of a whole.
- You can set the maximum number of slices or click the Add Data Series button.
- The completed widget looks like this:
Statistic Widget
Displays key performance metrics—such as average response time, error rate, or throughput—in a prominent numerical format.
- You can add up to 4 data series for a single statistic widget.
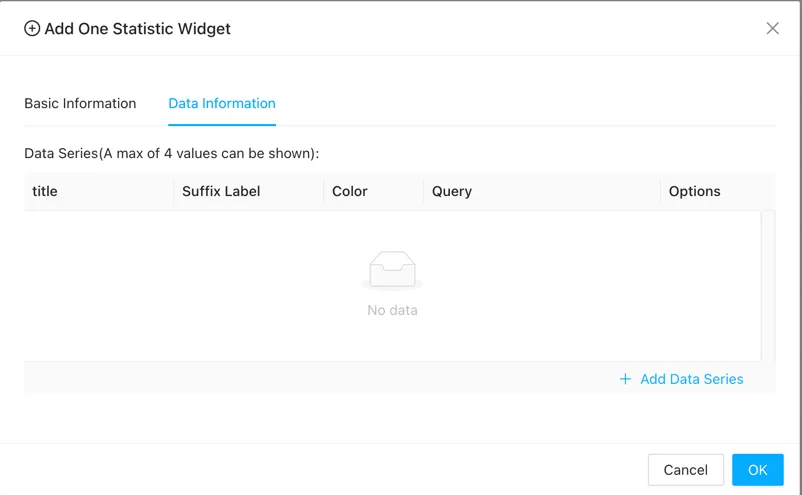
- There are three queries within a single data series configuration:
- The basic query functions similarly to other series configurations.
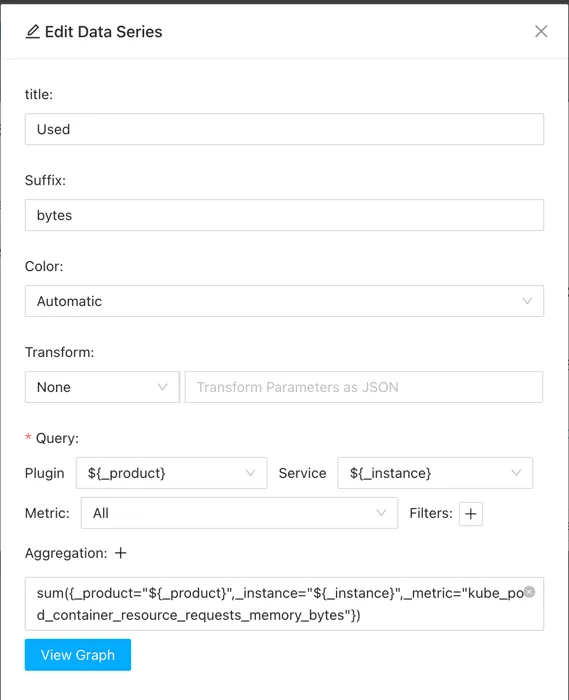
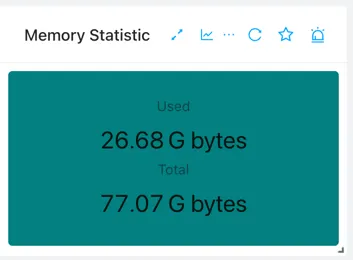
- The Sum Query displays the total value in the widget.
- The Background Query dynamically sets the widget’s background color based on the query result.
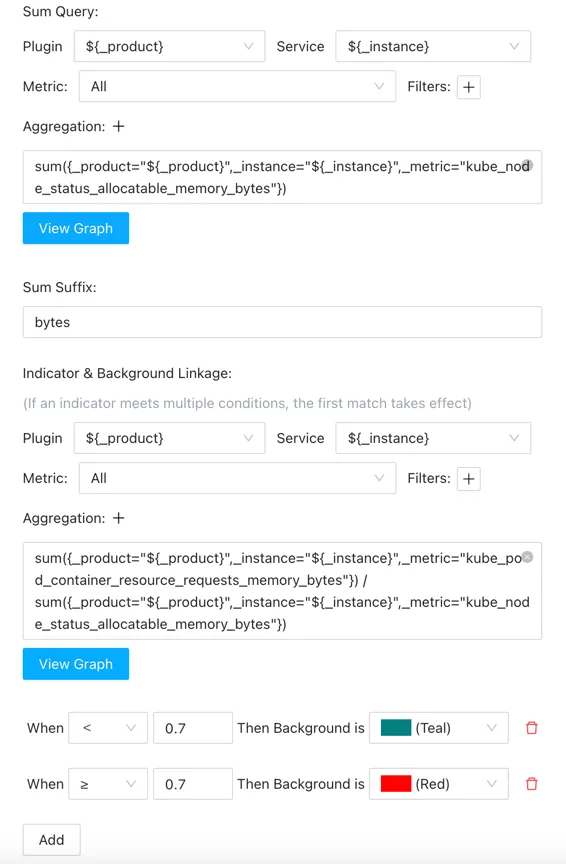
- The basic query functions similarly to other series configurations.
- The completed widget looks like this:
Text Widget
Allows users to add custom text, annotations, or dynamic warnings to the dashboard.
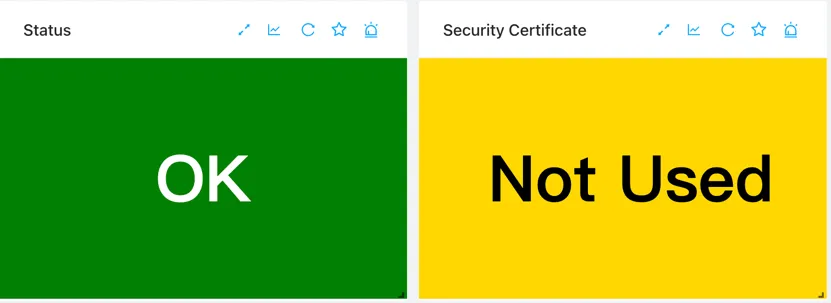
- Multiple text values and styles can be set here. The displayed text is determined by comparing the query results against defined thresholds.
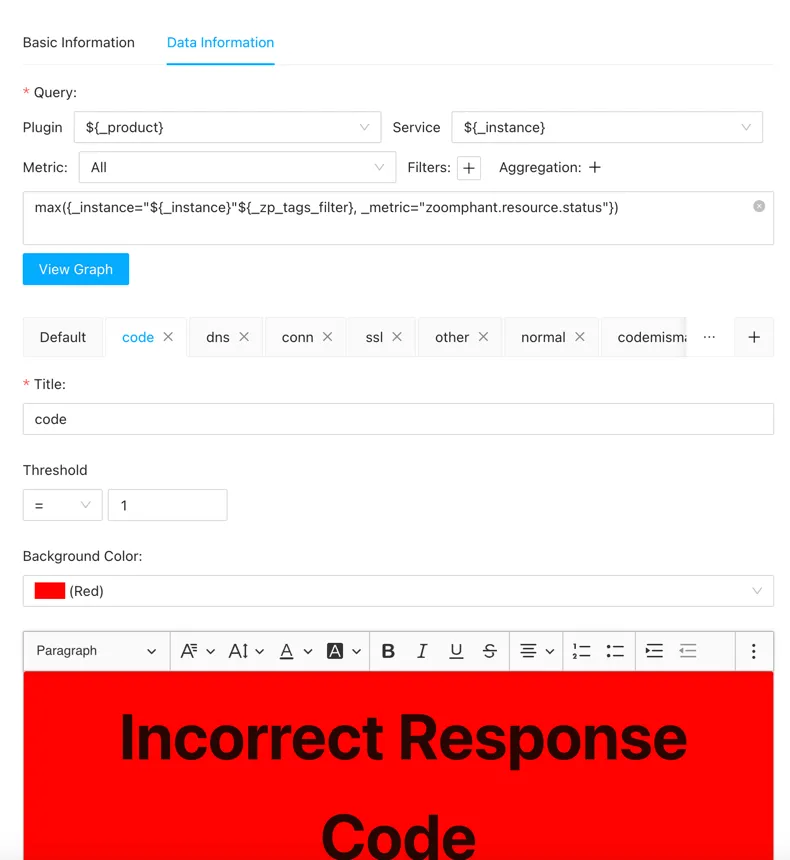
- The completed widget looks like this:
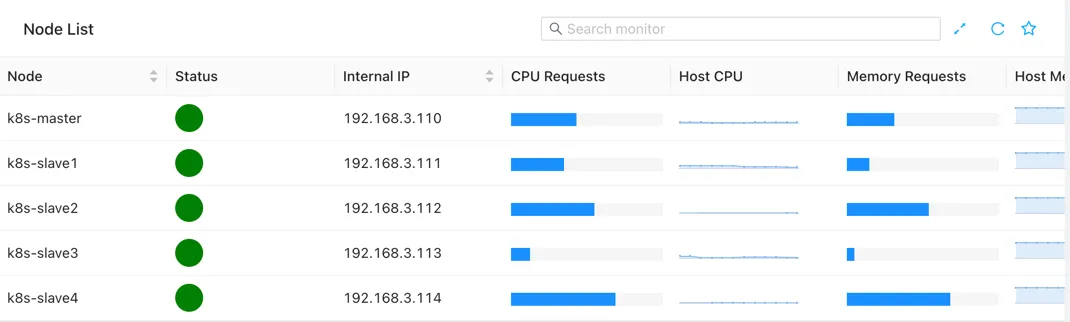
Monitor Table Widget
Presents tabular data, such as server status, resource utilization, or service availability, in a structured format.
- The completed widget looks like this:
Log Viewer Widget
Enables users to view and analyze log data from monitored services or components directly on the dashboard, facilitating troubleshooting and debugging.
Conclusion
Dashboards are essential components of monitoring systems, providing users with a centralized, real-time view of their IT infrastructure’s health and performance. In ZoomPhant, dashboards are highly customizable, offering global, service-level, and independent views. By leveraging a variety of widgets, ZoomPhant enables users to visualize and analyze monitoring data effectively, empowering them to make informed decisions and ensure the reliability and availability of their systems.