DNS Monitoring
DNS Monitoring
Domain Name System (DNS) resolution is a foundational pillar of internet infrastructure that is often overlooked until it fails. ZoomPhant’s DNS Monitoring provides simple, real-time insights into your DNS resolution health and latency.
Create DNS Monitoring
To start monitoring a domain (e.g., github.com), select the DNS Checker plugin from the plugin library. You will be prompted to configure the following parameters:
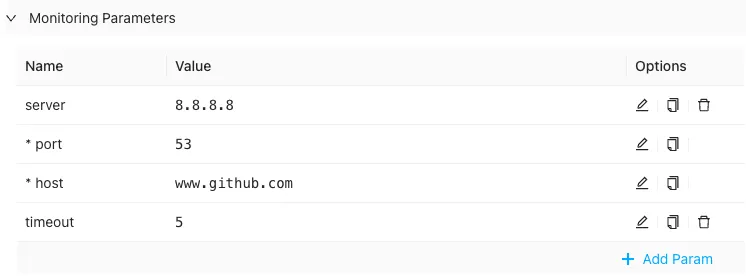
- server: The IP address of the DNS server to query (e.g.,
8.8.8.8or1.1.1.1). If left empty, the Data Collection Agent will use the host system’s default DNS server. - port: The port number of the DNS server. Defaults to
53, which is the standard DNS port. - host: The domain name you want to resolve (e.g.,
www.github.com). This is a required field. - timeout: The query timeout in seconds. Because DNS resolution is usually completed in tens of milliseconds, the default value of
5seconds is sufficient.
Once you have configured the parameters, click Test to verify resolution, and then click Finish to add the monitoring service.
Understanding DNS Checker Metrics
After adding the service, wait a few seconds for the initial collection cycle. Select the service from the services list to view the DNS dashboard:
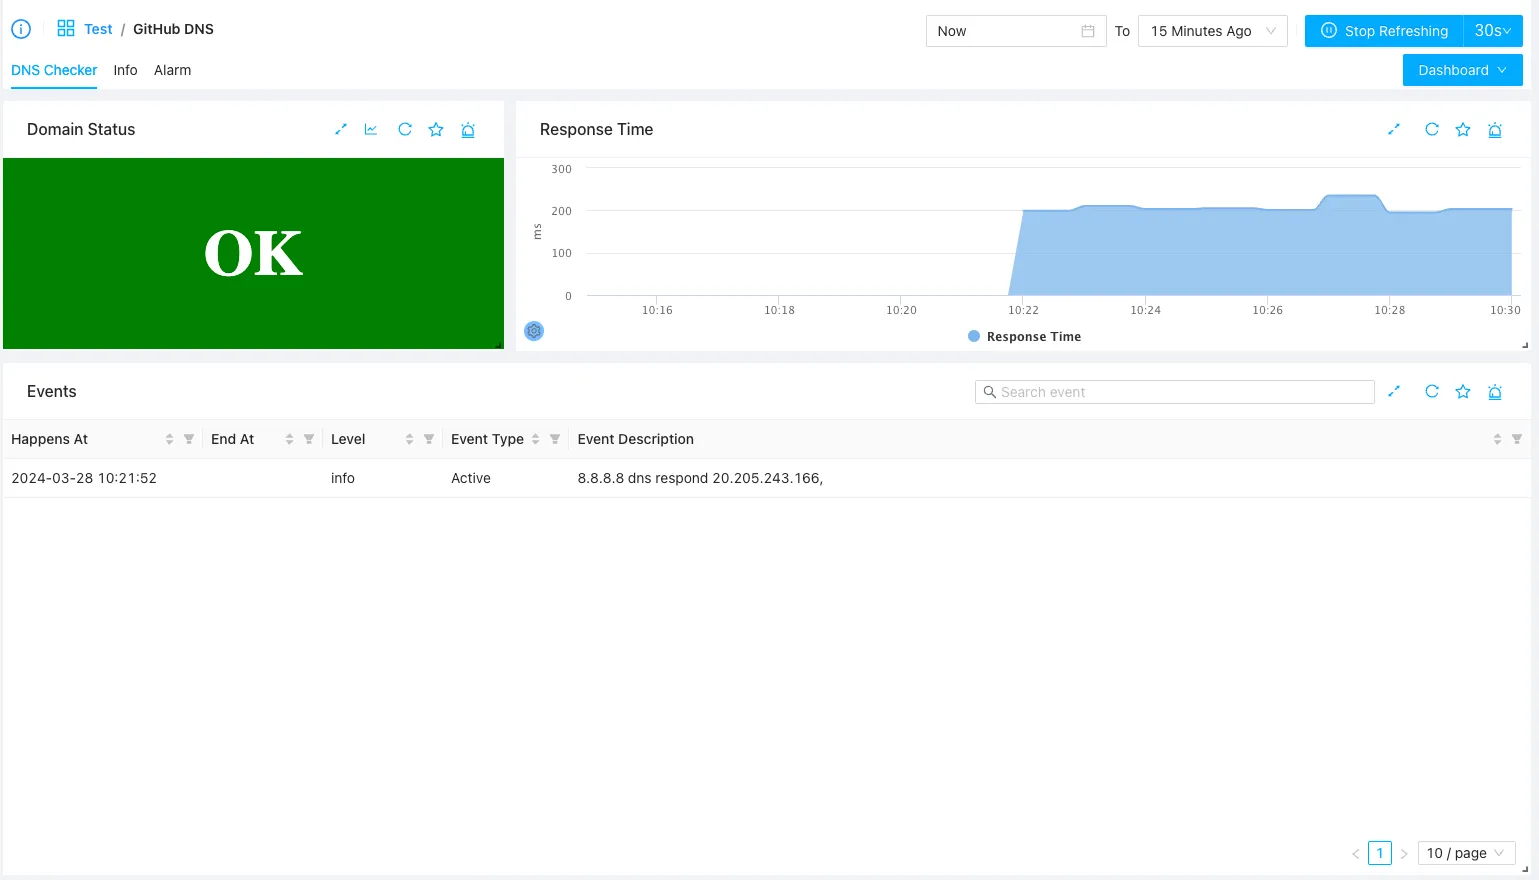
The dashboard highlights three key metrics and data points:
- Overall Status: Displays
OKif resolution is successful. If an issue occurs (e.g., domain does not exist or timeout), a short error description is displayed. - Response Time: The time taken (in milliseconds) to resolve the domain. This is tracked on a line chart to help identify latency spikes or DNS server performance degradation.
- Resolved IP Addresses (Events): Lists the IP addresses returned by the DNS server. This helps verify that your DNS configuration is routing users to the correct servers and alerts you to potential DNS hijacking or cache pollution.