Kafka Monitoring
Kafka Monitoring
ZoomPhant provides a straightforward way to monitor one or more Apache Kafka clusters using the Kafka plugin.
Creating a Kafka Monitoring Service
To start monitoring a Kafka cluster, choose the Kafka plugin as described in Add Monitor Service and specify the following configuration parameter:
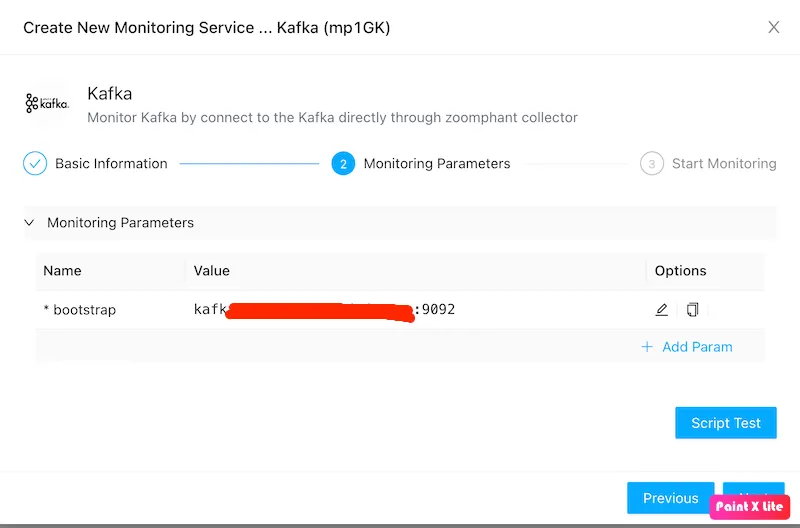
- bootstrap: The bootstrap server URLs (e.g., a comma-separated list of
host:port) for the Kafka cluster.
Once the parameters are set and the service is created, wait a few seconds for data collection to initialize, and the dashboards will begin showing data.
Understanding Kafka Data
ZoomPhant organizes Kafka monitoring metrics into three main dashboards:
Cluster Dashboard
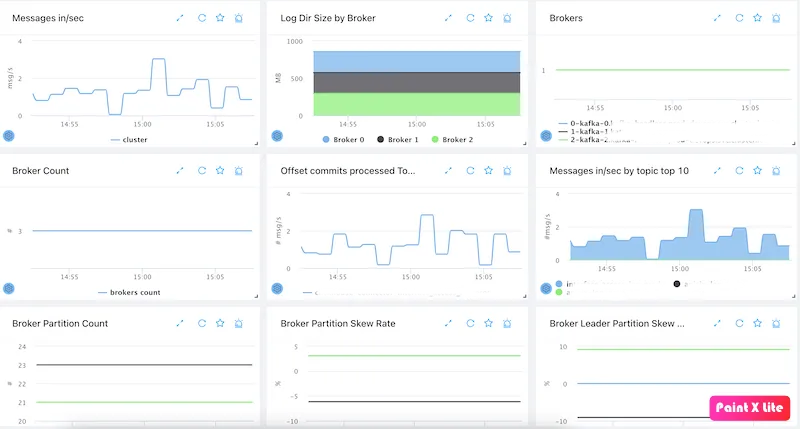
This view displays the following cluster-level metrics:
- Message input rate at the cluster level.
- Log directory size on disk per broker.
- Broker status and active broker count.
- Top 10 highest offset commit rates.
- Top 10 topics by message input rate.
- Partition count per broker.
- Broker partition skew rate (measuring partition distribution imbalance across brokers).
- Broker leader partition skew rate.
Consumer Group Dashboard
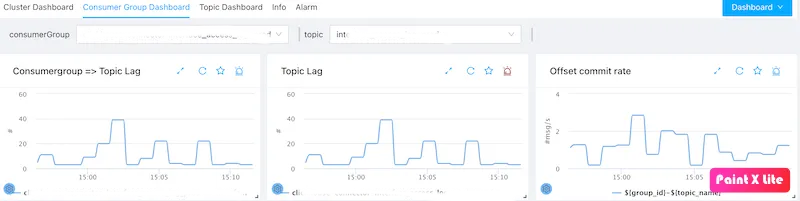
This view displays the following consumer group metrics:
- Consumer group-level topic lag (unread messages).
- Offset commit rate per consumer group.
Topic Dashboard
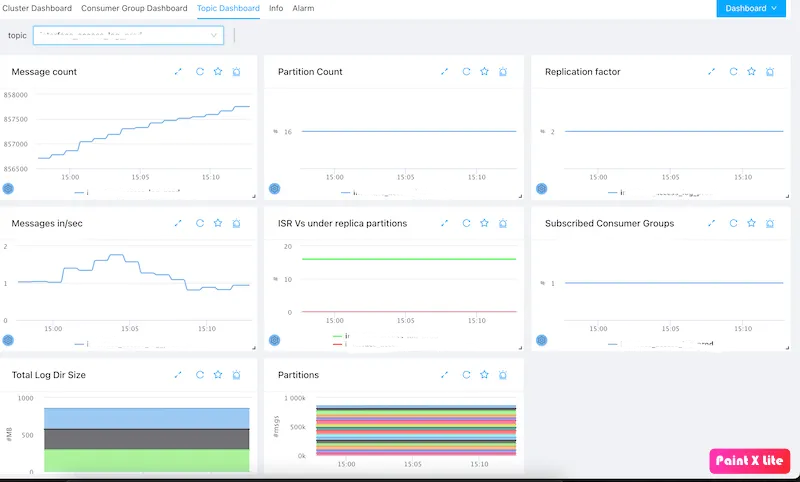
This view displays the following topic-specific metrics:
- Total message count for a topic.
- Partition count for a topic.
- Replication factor for a topic.
- Message input rate per topic.
- In-Sync Replicas (ISR) and Under-Replicated Partitions (URP).
- Number of subscribed consumer groups.
- Log directory size for this topic across brokers.
- Message offset details per partition for the topic.
Monitoring Multiple Kafka Clusters
To monitor multiple Kafka clusters, simply add a separate monitoring service for each cluster.