Import Grafana Dashboard
Grafana is a popular open-source visualization platform. It has excellent support for Prometheus-compatible data sources, making it easy to display metrics collected by Prometheus exporters.
This section describes how to import a Grafana dashboard into a custom ZoomPhant monitoring plugin.
Finding a Grafana Dashboard
First, locate the Grafana dashboard designed for your target exporter. While a template plugin defines how data is collected, the imported dashboard defines how that data is visually presented.
For this example, let’s assume we created a custom plugin for Spring Boot applications (as described in Prometheus Template Plugins). By searching the Grafana dashboard library for “SpringBoot”, we find a matching dashboard:
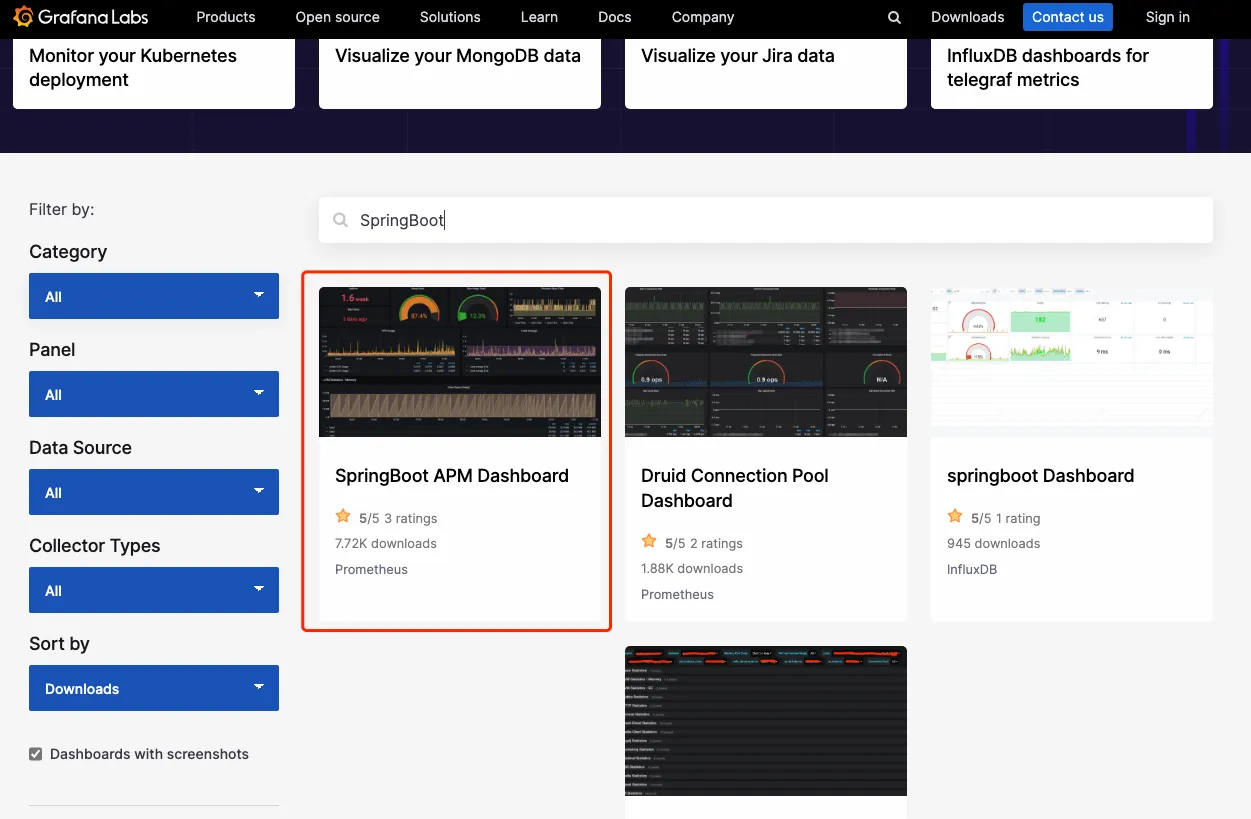
Click the dashboard to find its ID or URL, which you will use in the next step.
Importing the Grafana Dashboard
- Navigate to Settings > Custom Monitoring Plugins and locate the custom plugin you created:
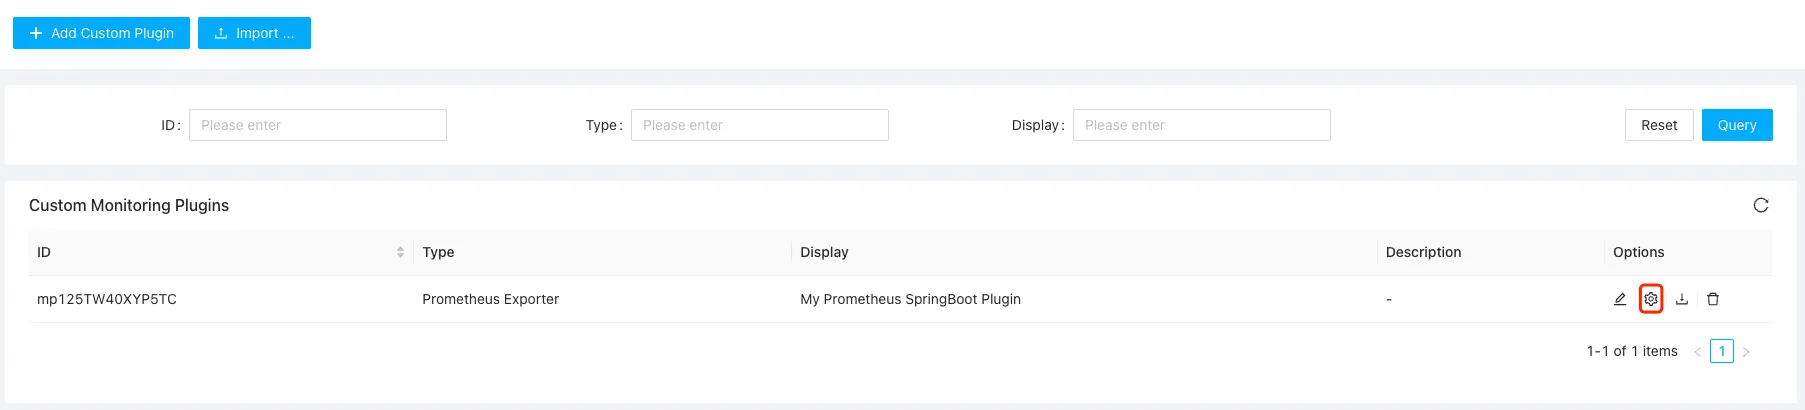
- Click the Settings icon to open the configuration dialog:
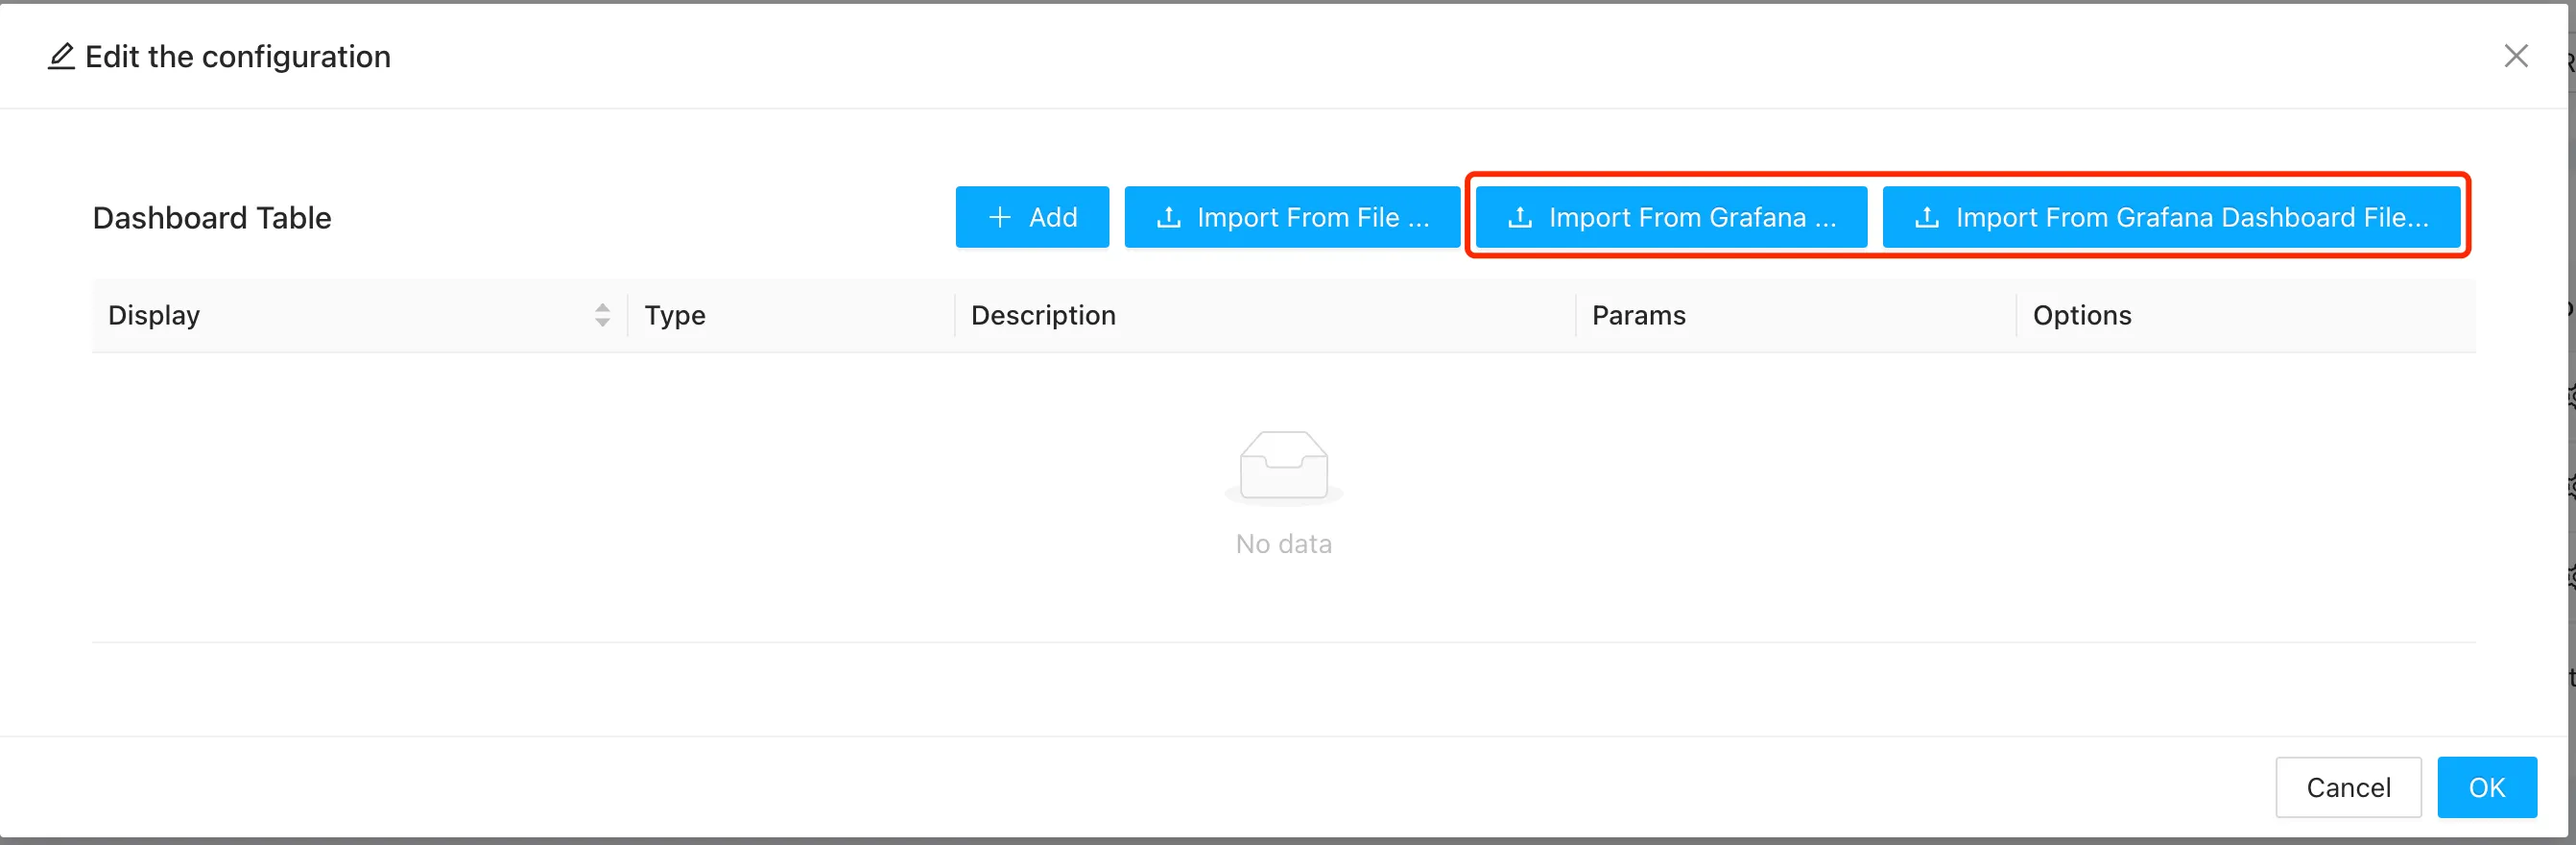
- In the dialog, you can import the dashboard using one of two methods:
- File Upload: If you have downloaded the dashboard JSON file, click Import From Grafana Dashboard File and select the file.
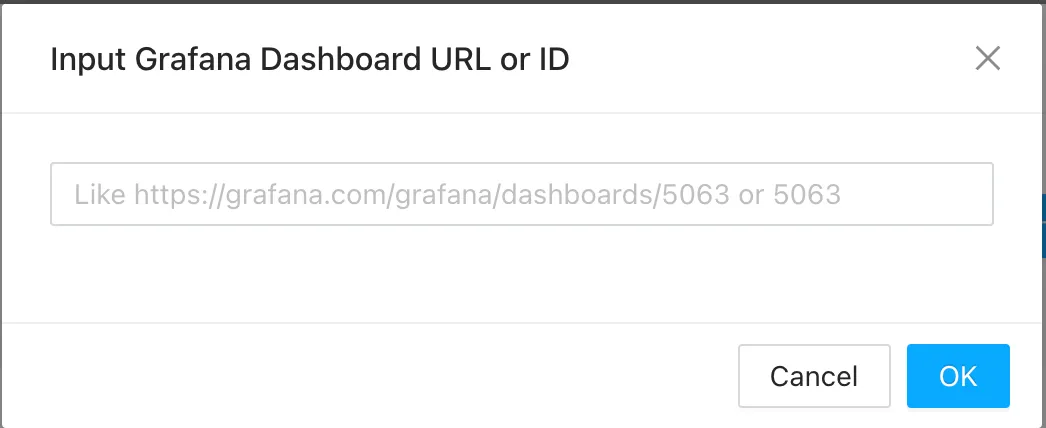
- Direct Import: Alternatively, click Import From Grafana to open the direct import dialog:
-
Enter the Grafana dashboard ID (e.g.,
12900for the Spring Boot dashboard) or the full dashboard URL (e.g.,https://grafana.com/grafana/dashboards/12900-springboot-apm-dashboard): -
Click Import and wait a few seconds. The dashboard layout and panel configurations will be imported:
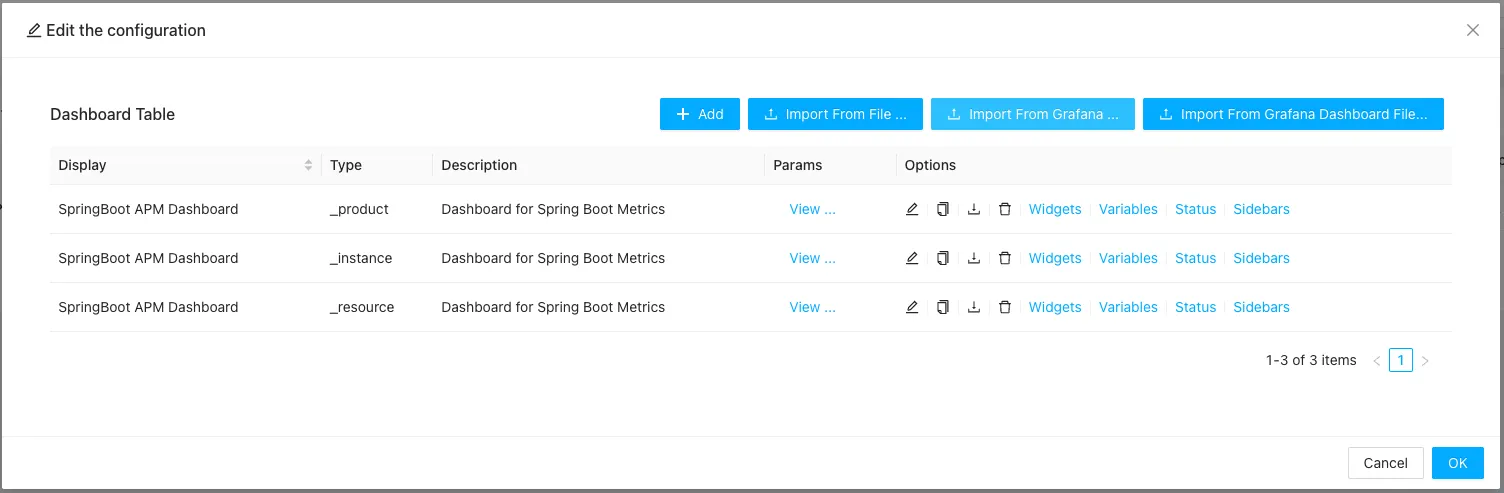
- Click OK to save. If you navigate to any monitoring service created using this custom plugin, the imported dashboard will now display the collected metrics.