Kubernetes Monitoring
Kubernetes Monitoring
Kubernetes is widely used for modern application deployment. ZoomPhant provides native Kubernetes monitoring. By installing the ZoomPhant Kubernetes collector, you can quickly bring your entire cluster under control.
Install the Kubernetes Collector
Follow the instructions in Install Collectors and choose Kubernetes as the underlying infrastructure. This will guide you through creating a Kubernetes collector and its corresponding monitoring service.
Providing Kubernetes Cluster Information
When creating a Kubernetes collector, you need to provide basic details about the cluster in step 2 of the wizard:
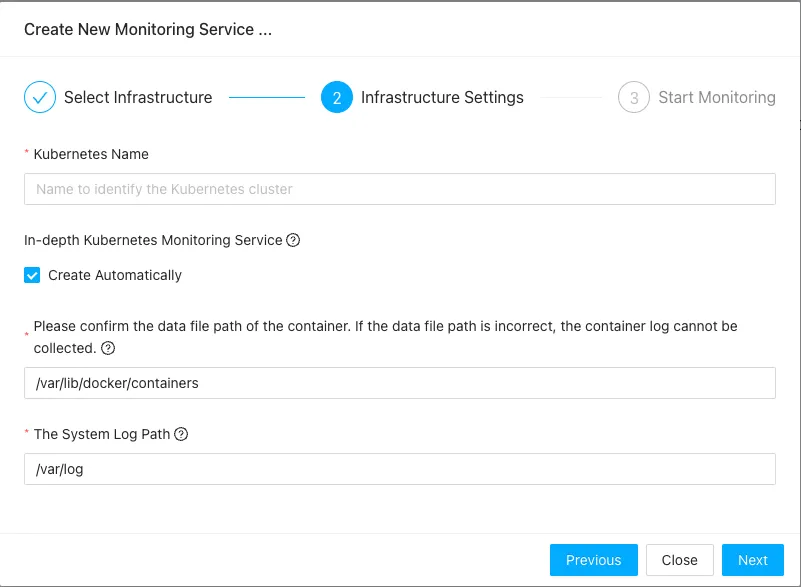
Here, you will need to provide the name of the cluster, which is also used to identify the collector. You can keep the default values for the Docker and logging configurations unless you have specific environment requirements.
After entering this information, the final step provides instructions for installing the collector.
Installing the Kubernetes Collector
Installing the Kubernetes collector is straightforward: copy the generated command and execute it in your terminal to deploy the agent.
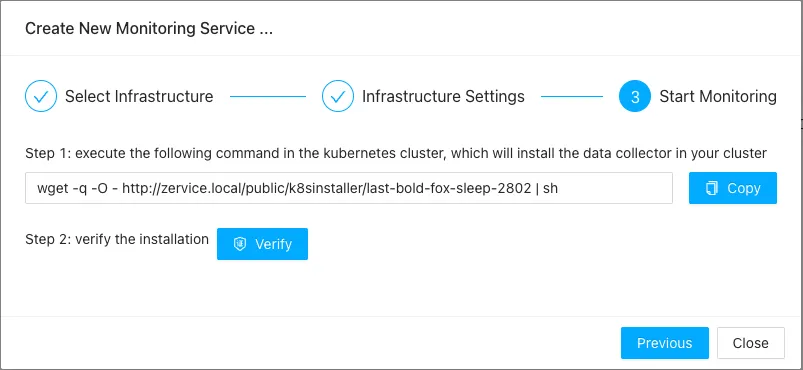
The Kubernetes collector is deployed as a DaemonSet. You must run the command in a terminal where kubectl is configured with appropriate cluster privileges. The command downloads and applies a manifest file to your cluster, creating a namespace called zoomphant-collector where the collector pods will run.
You can verify the installation by clicking the Verify button. Once registered, you can view the metrics reporting from your Kubernetes cluster.
Understanding Kubernetes Data
Because Kubernetes is a highly structured environment, the collector automatically discovers and monitors cluster resources without requiring you to manually configure additional services. Navigate to the newly created service page to view the default Kubernetes dashboards:
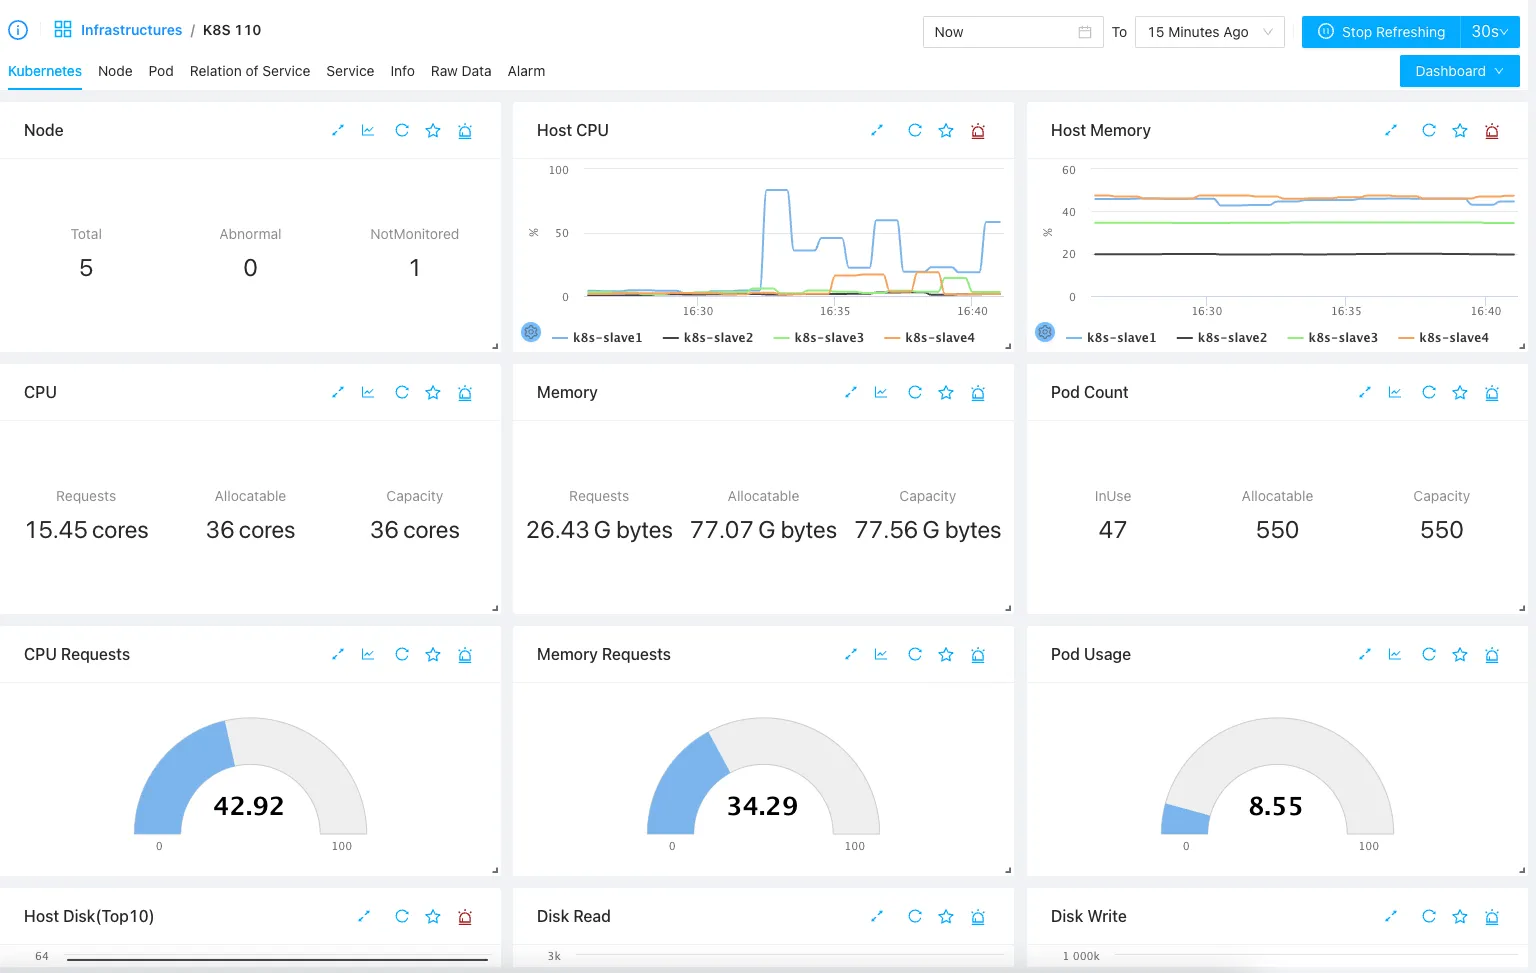
The dashboard includes the following views:
- Kubernetes: Displays critical cluster-wide information, including overall status, resource usage, and cluster events.
- Node: Lists all nodes in the cluster along with high-level performance metrics.
- Pod: Lists all pods and provides resource usage and status details.
- Service: Lists all detected services within the cluster.
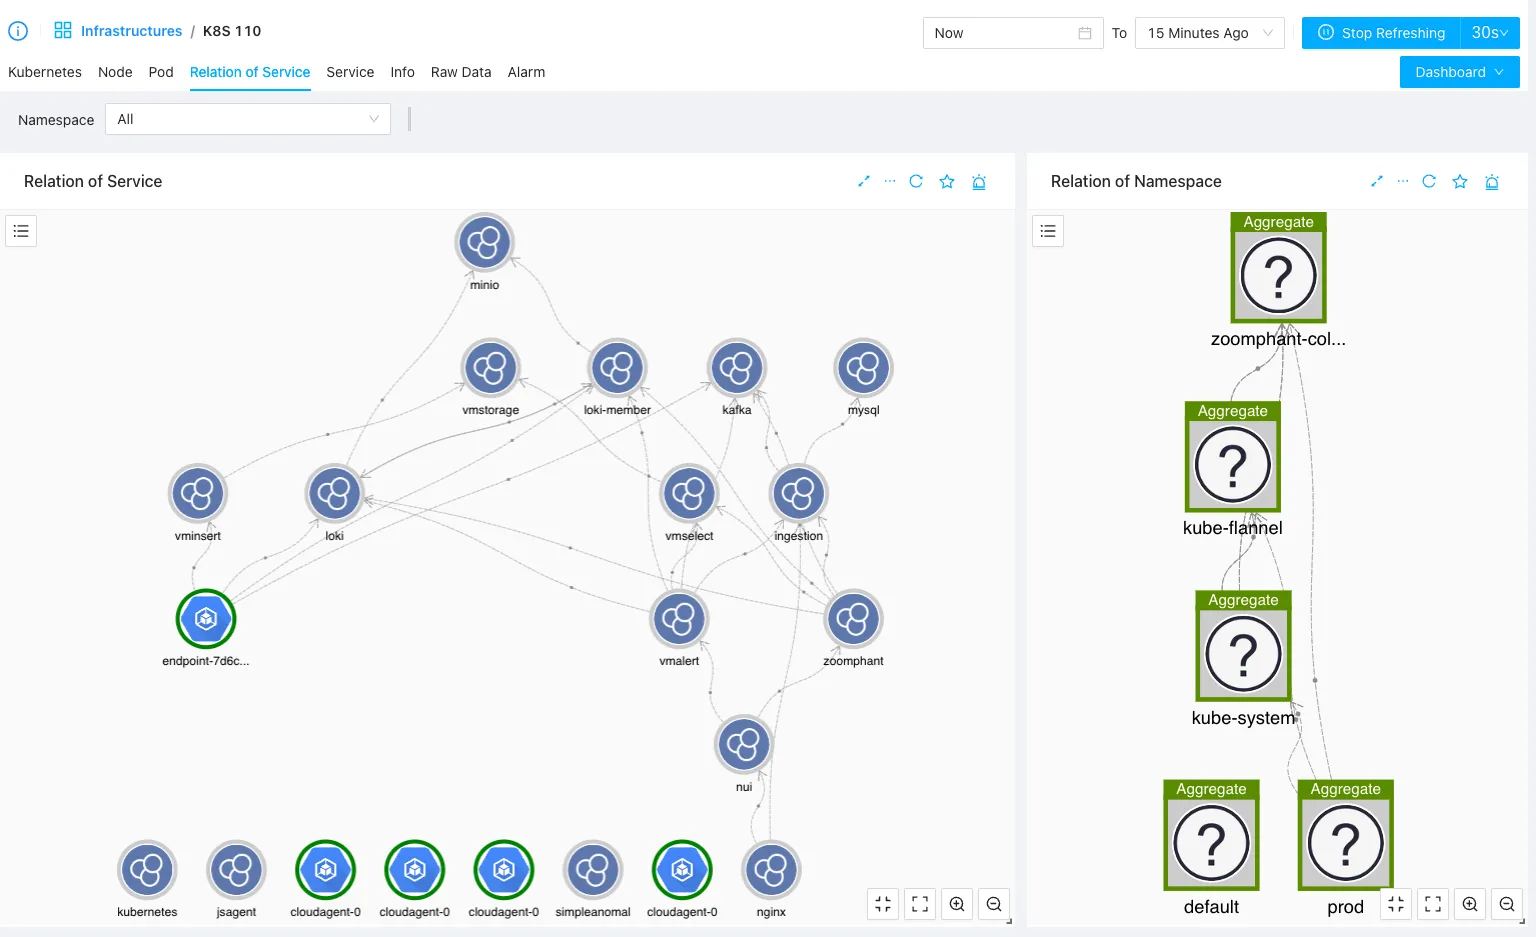
- Relation of Service: A dependency diagram mapping traffic and communication paths between services and namespaces.
Nodes, Pods, and Services
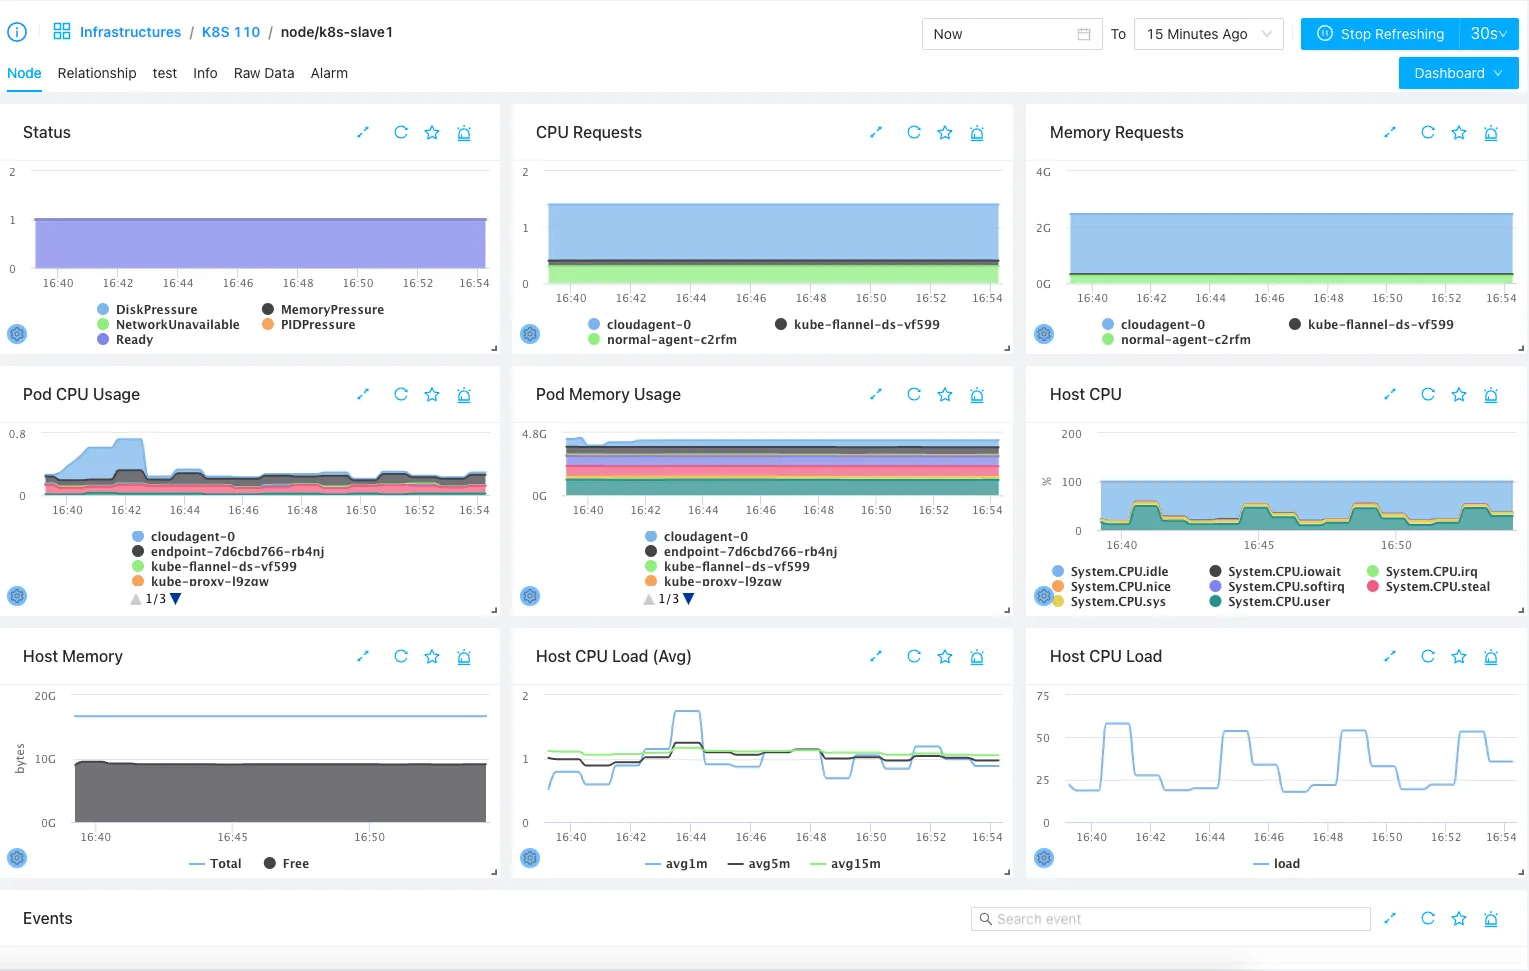
ZoomPhant provides interactive lists of all nodes, pods, and services in your cluster. Switch tabs to view lists of resources, and click any item to drill down into a sub-dashboard for that specific resource:
Node List & Per-Node Dashboard
Navigate to the Node tab to find the node list widget. You can drag and drop this widget to rearrange your dashboard layout:
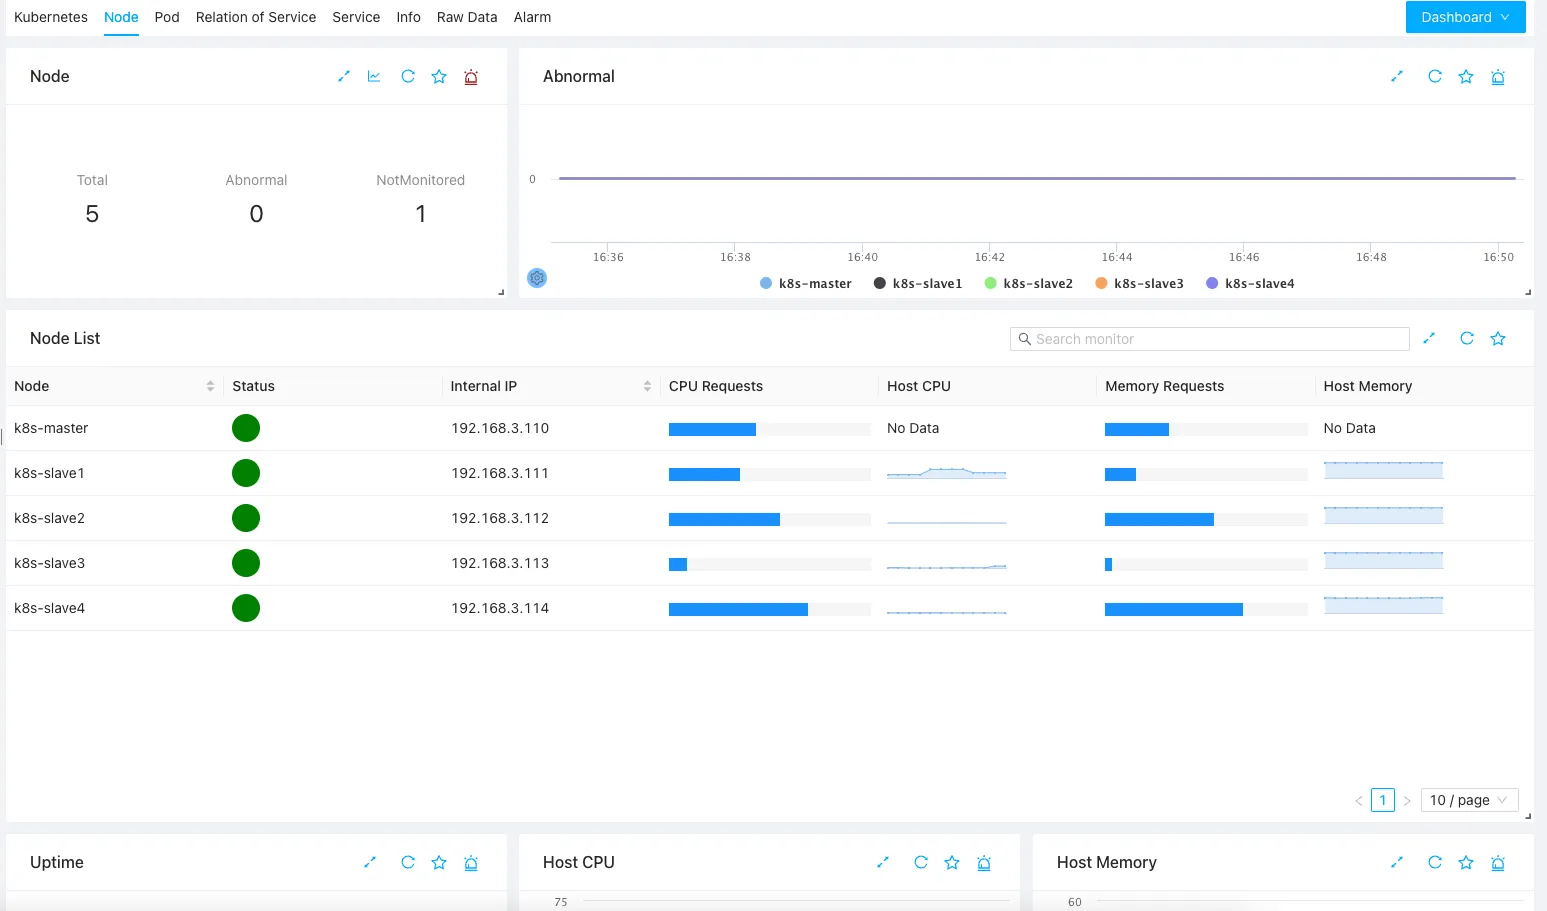
Click any row to open the detailed node dashboard:
Pod List and Per-Pod Dashboards
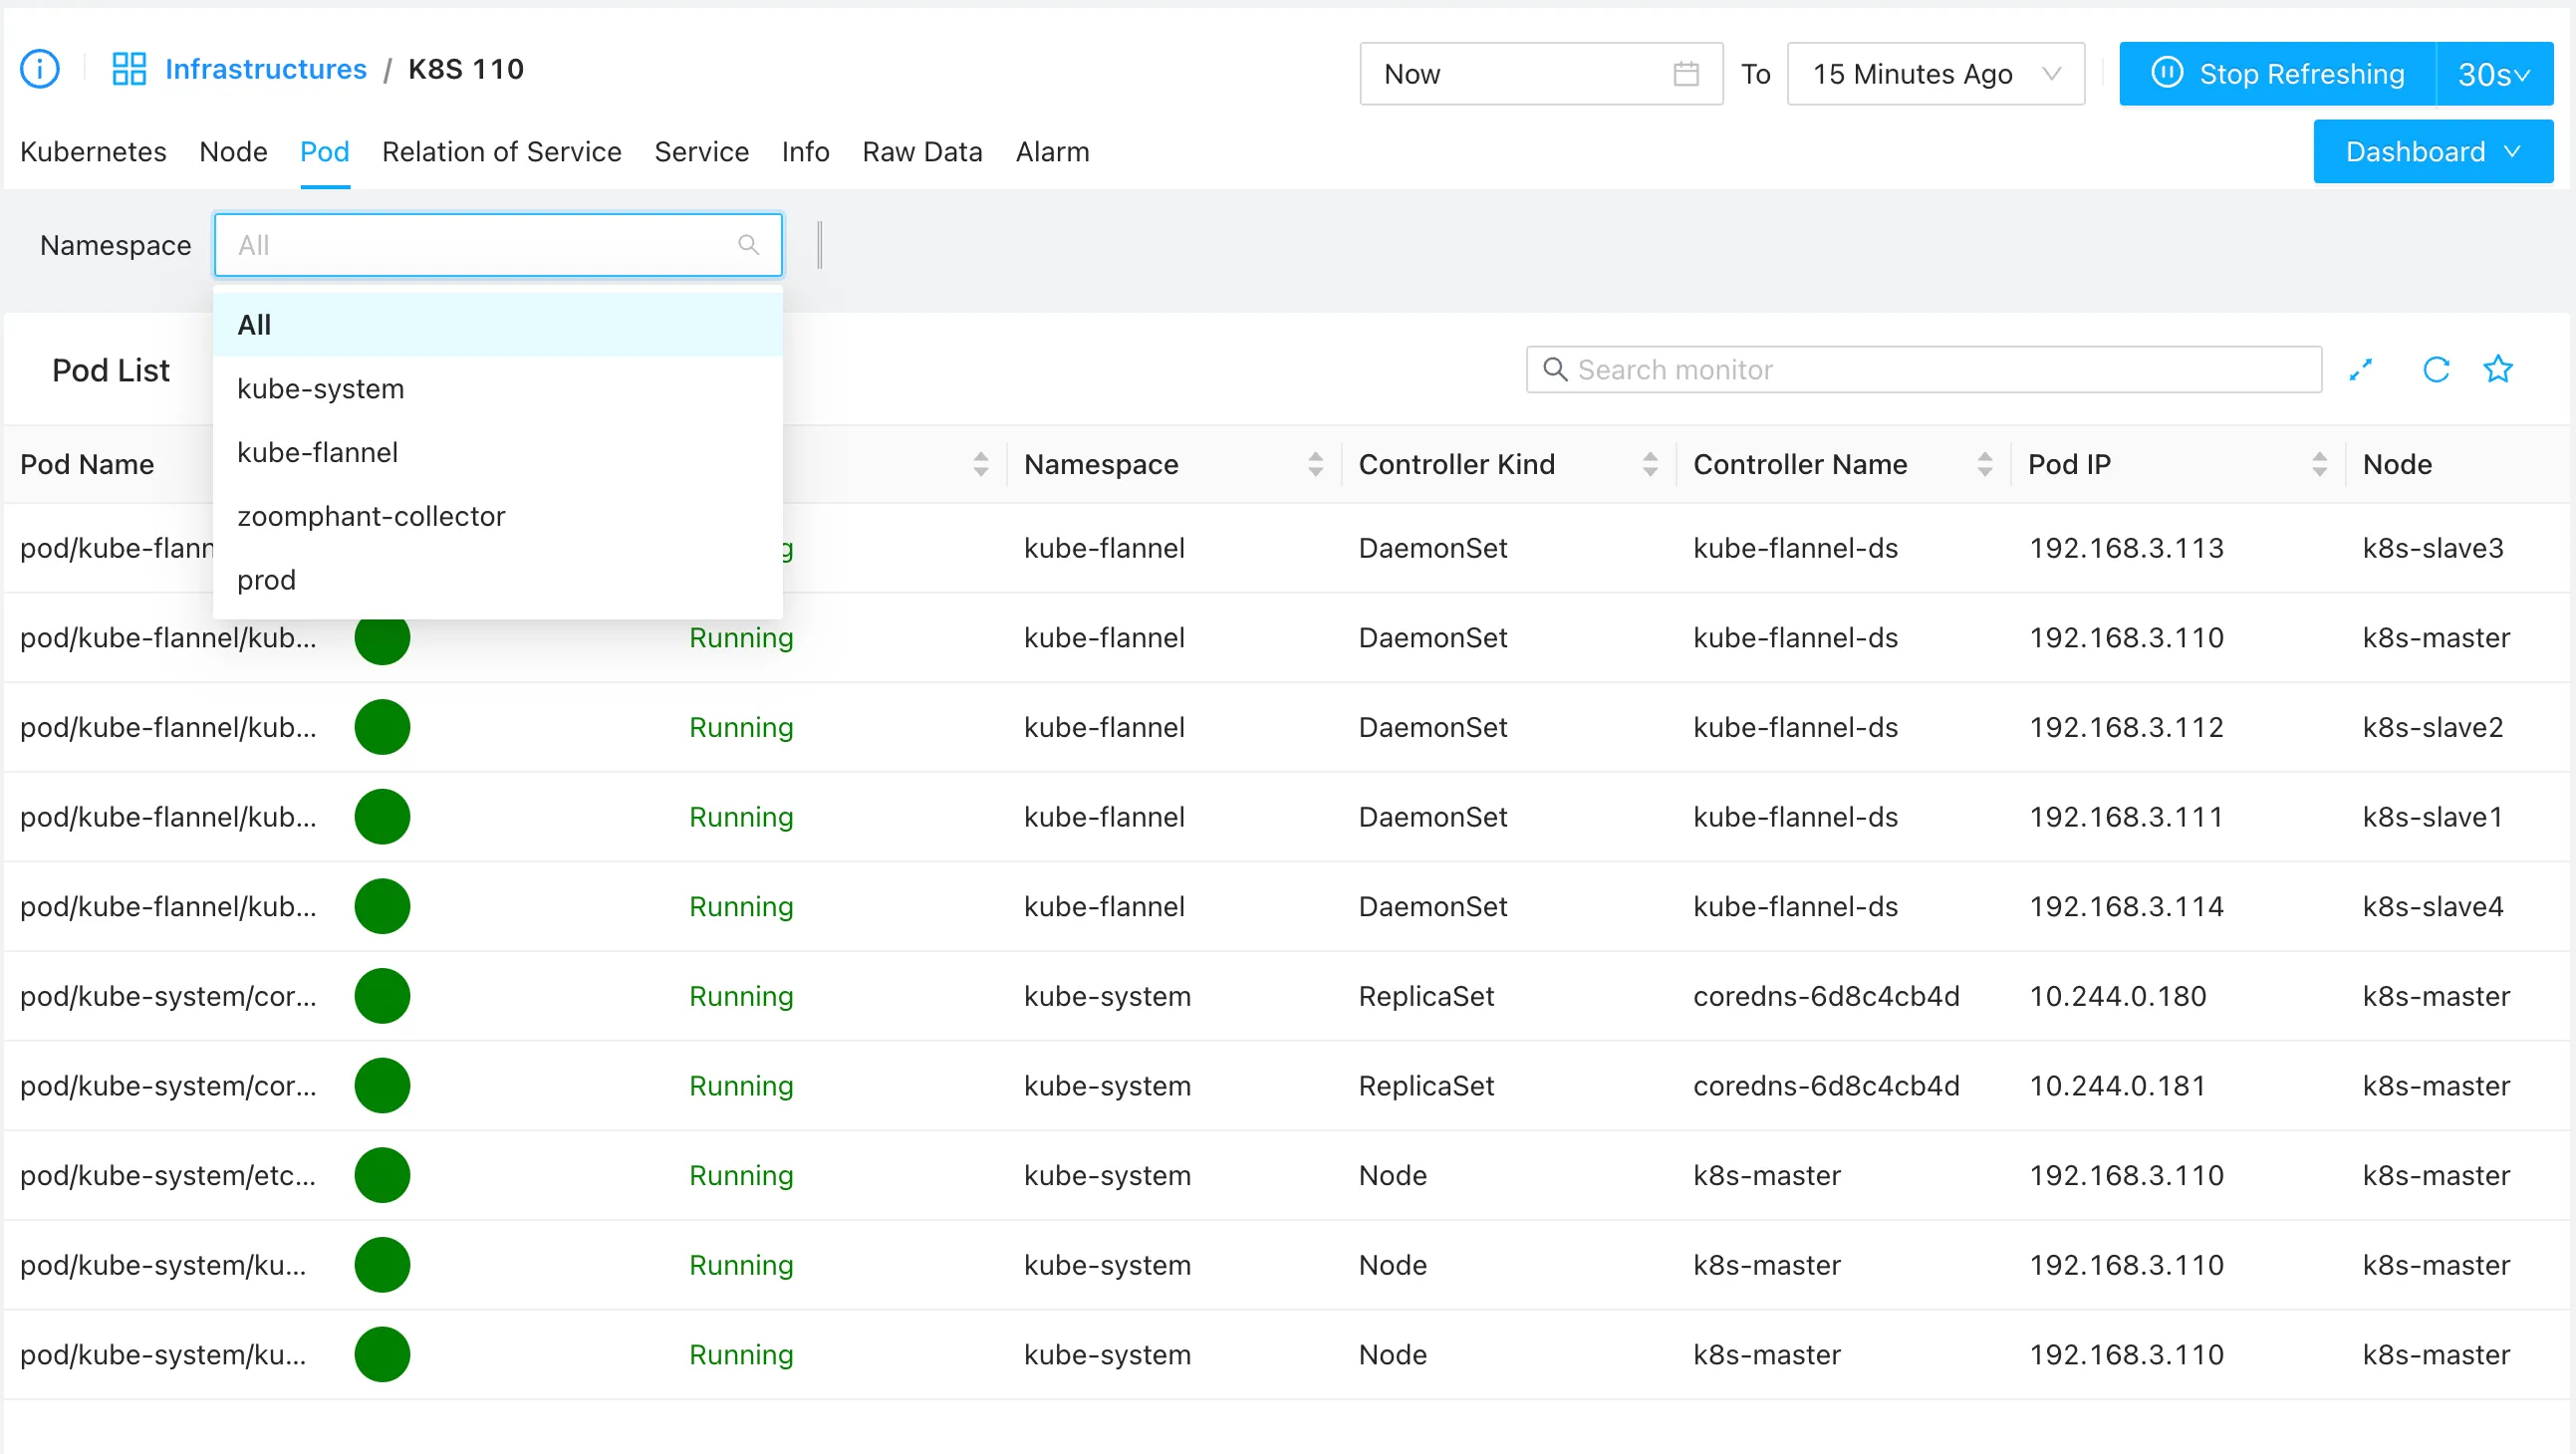
Similarly, you can switch to the Pod tab to see the active pods, which you can filter by namespace:
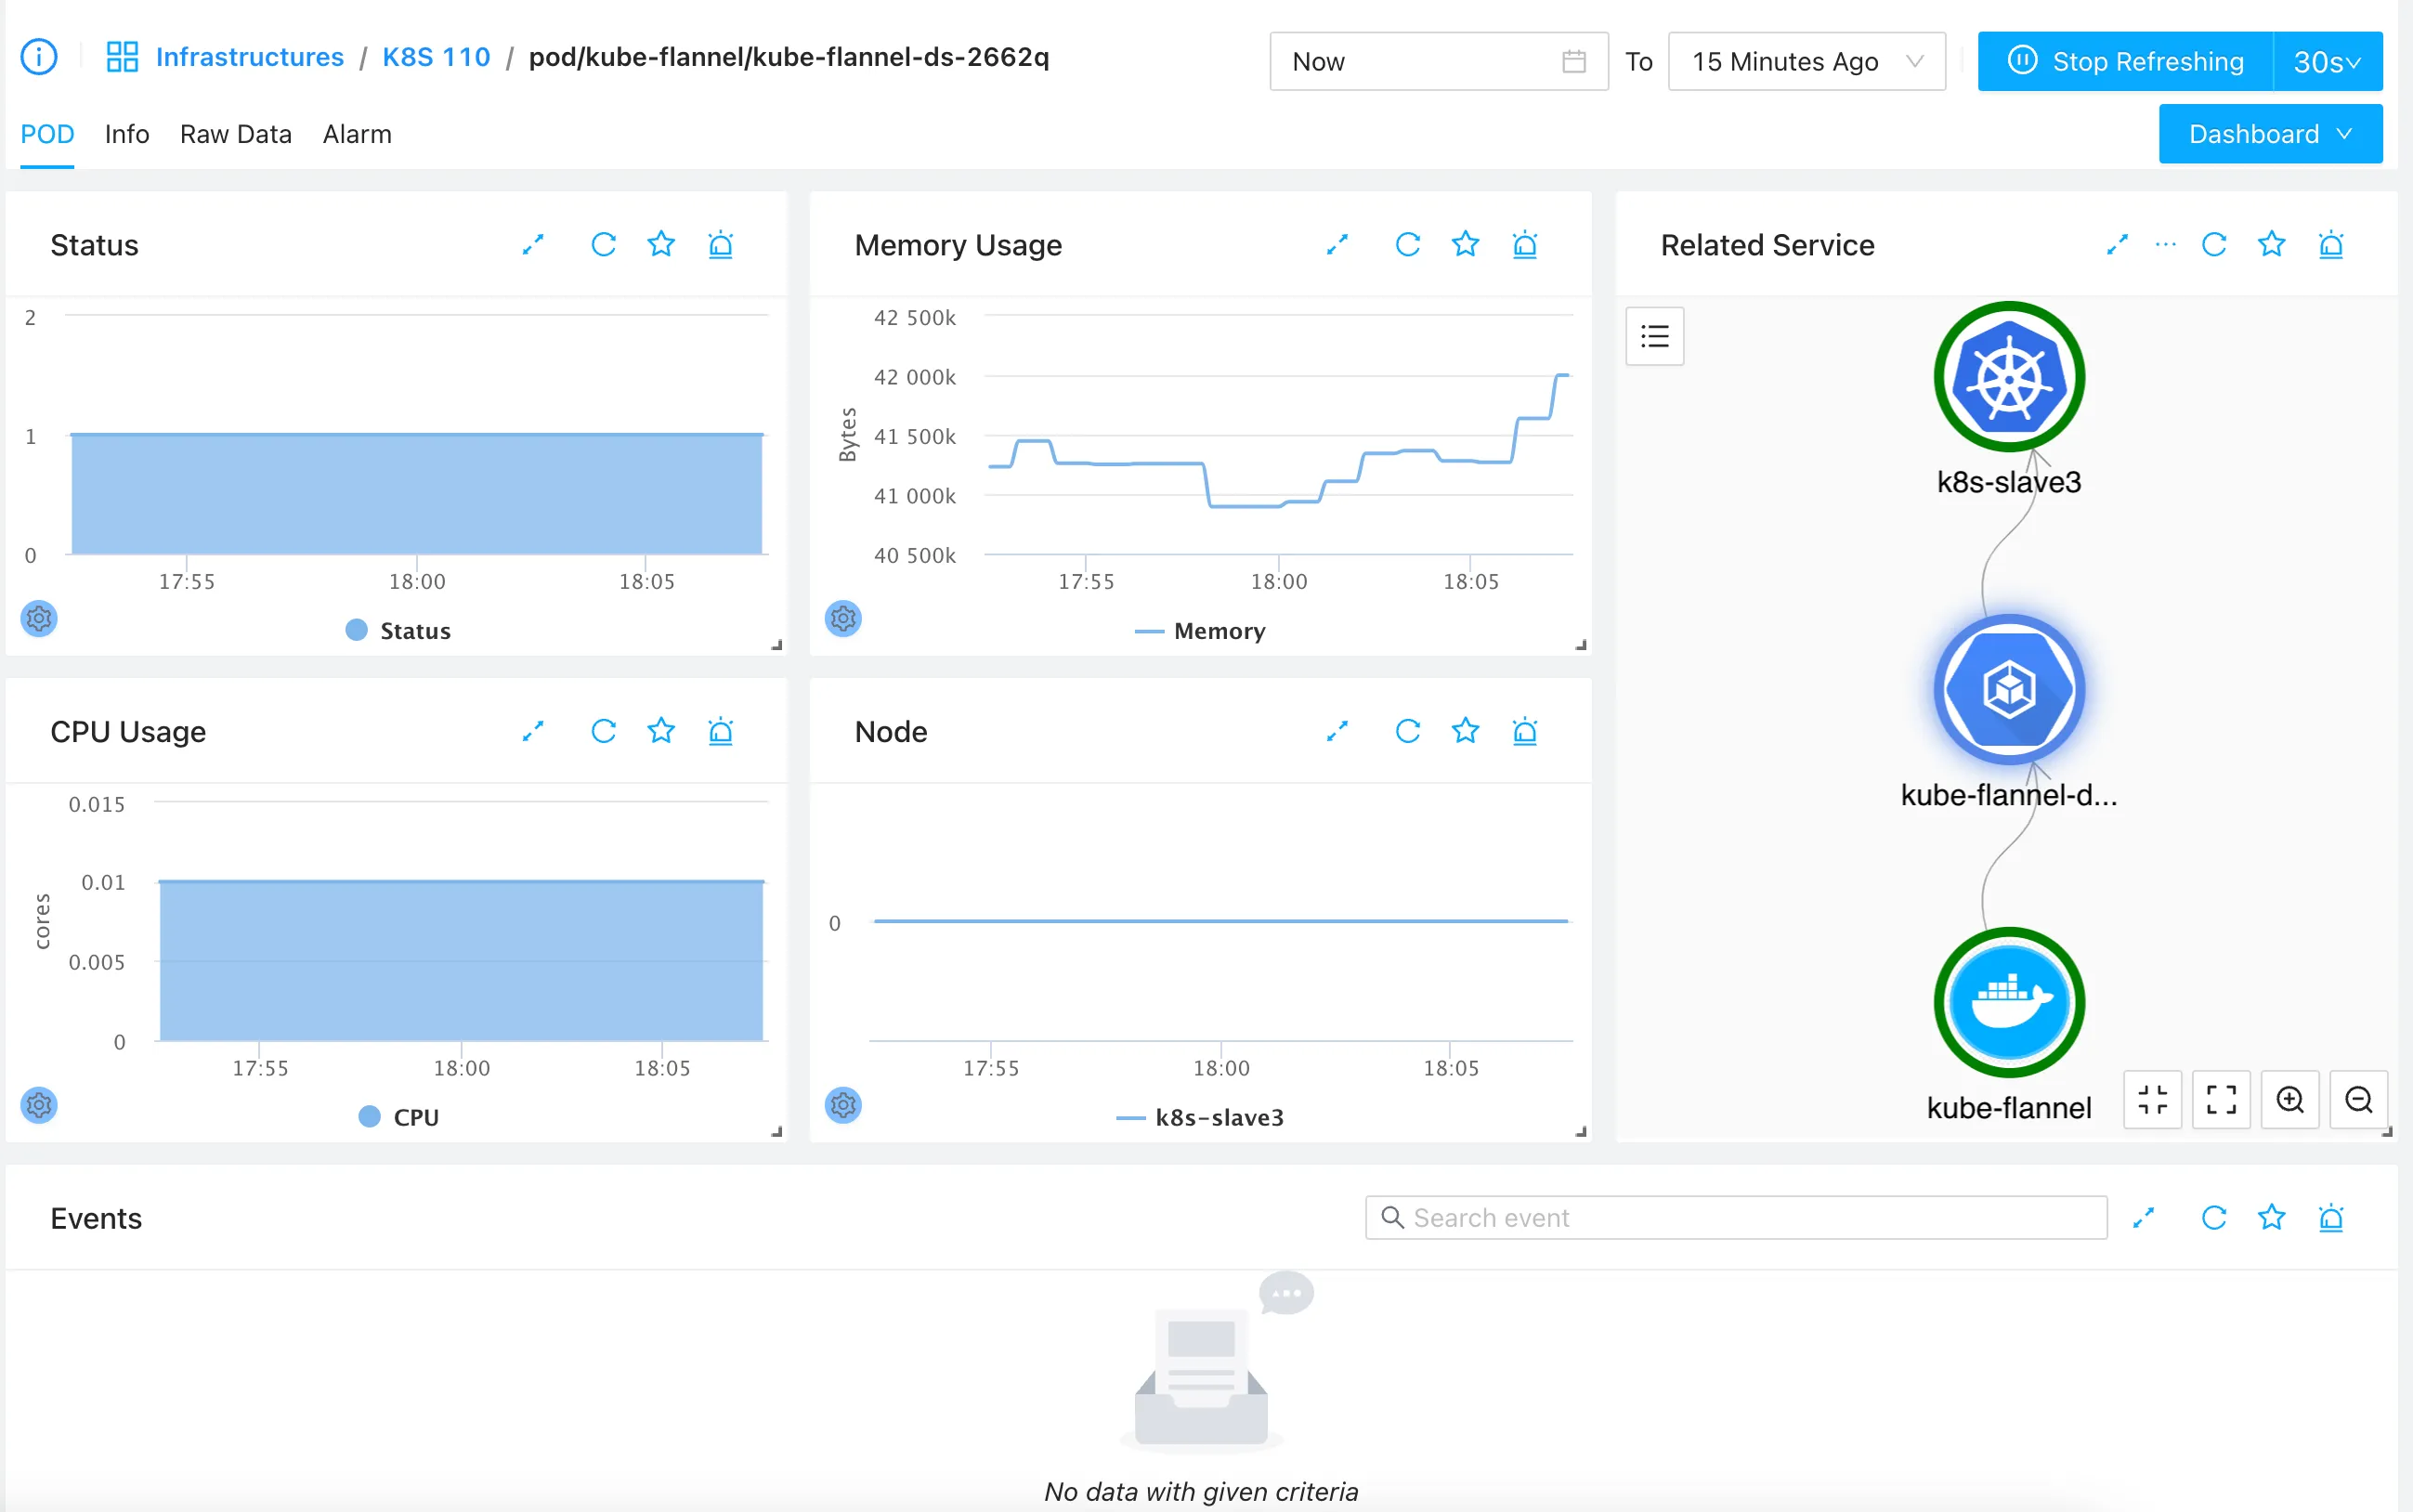
Click any pod in the list to open its specific dashboard:
Service List & Per-Service Dashboard
Services are key communication pathways in Kubernetes. The Service tab displays all services detected in the cluster and allows you to attach additional application-level monitors to them.
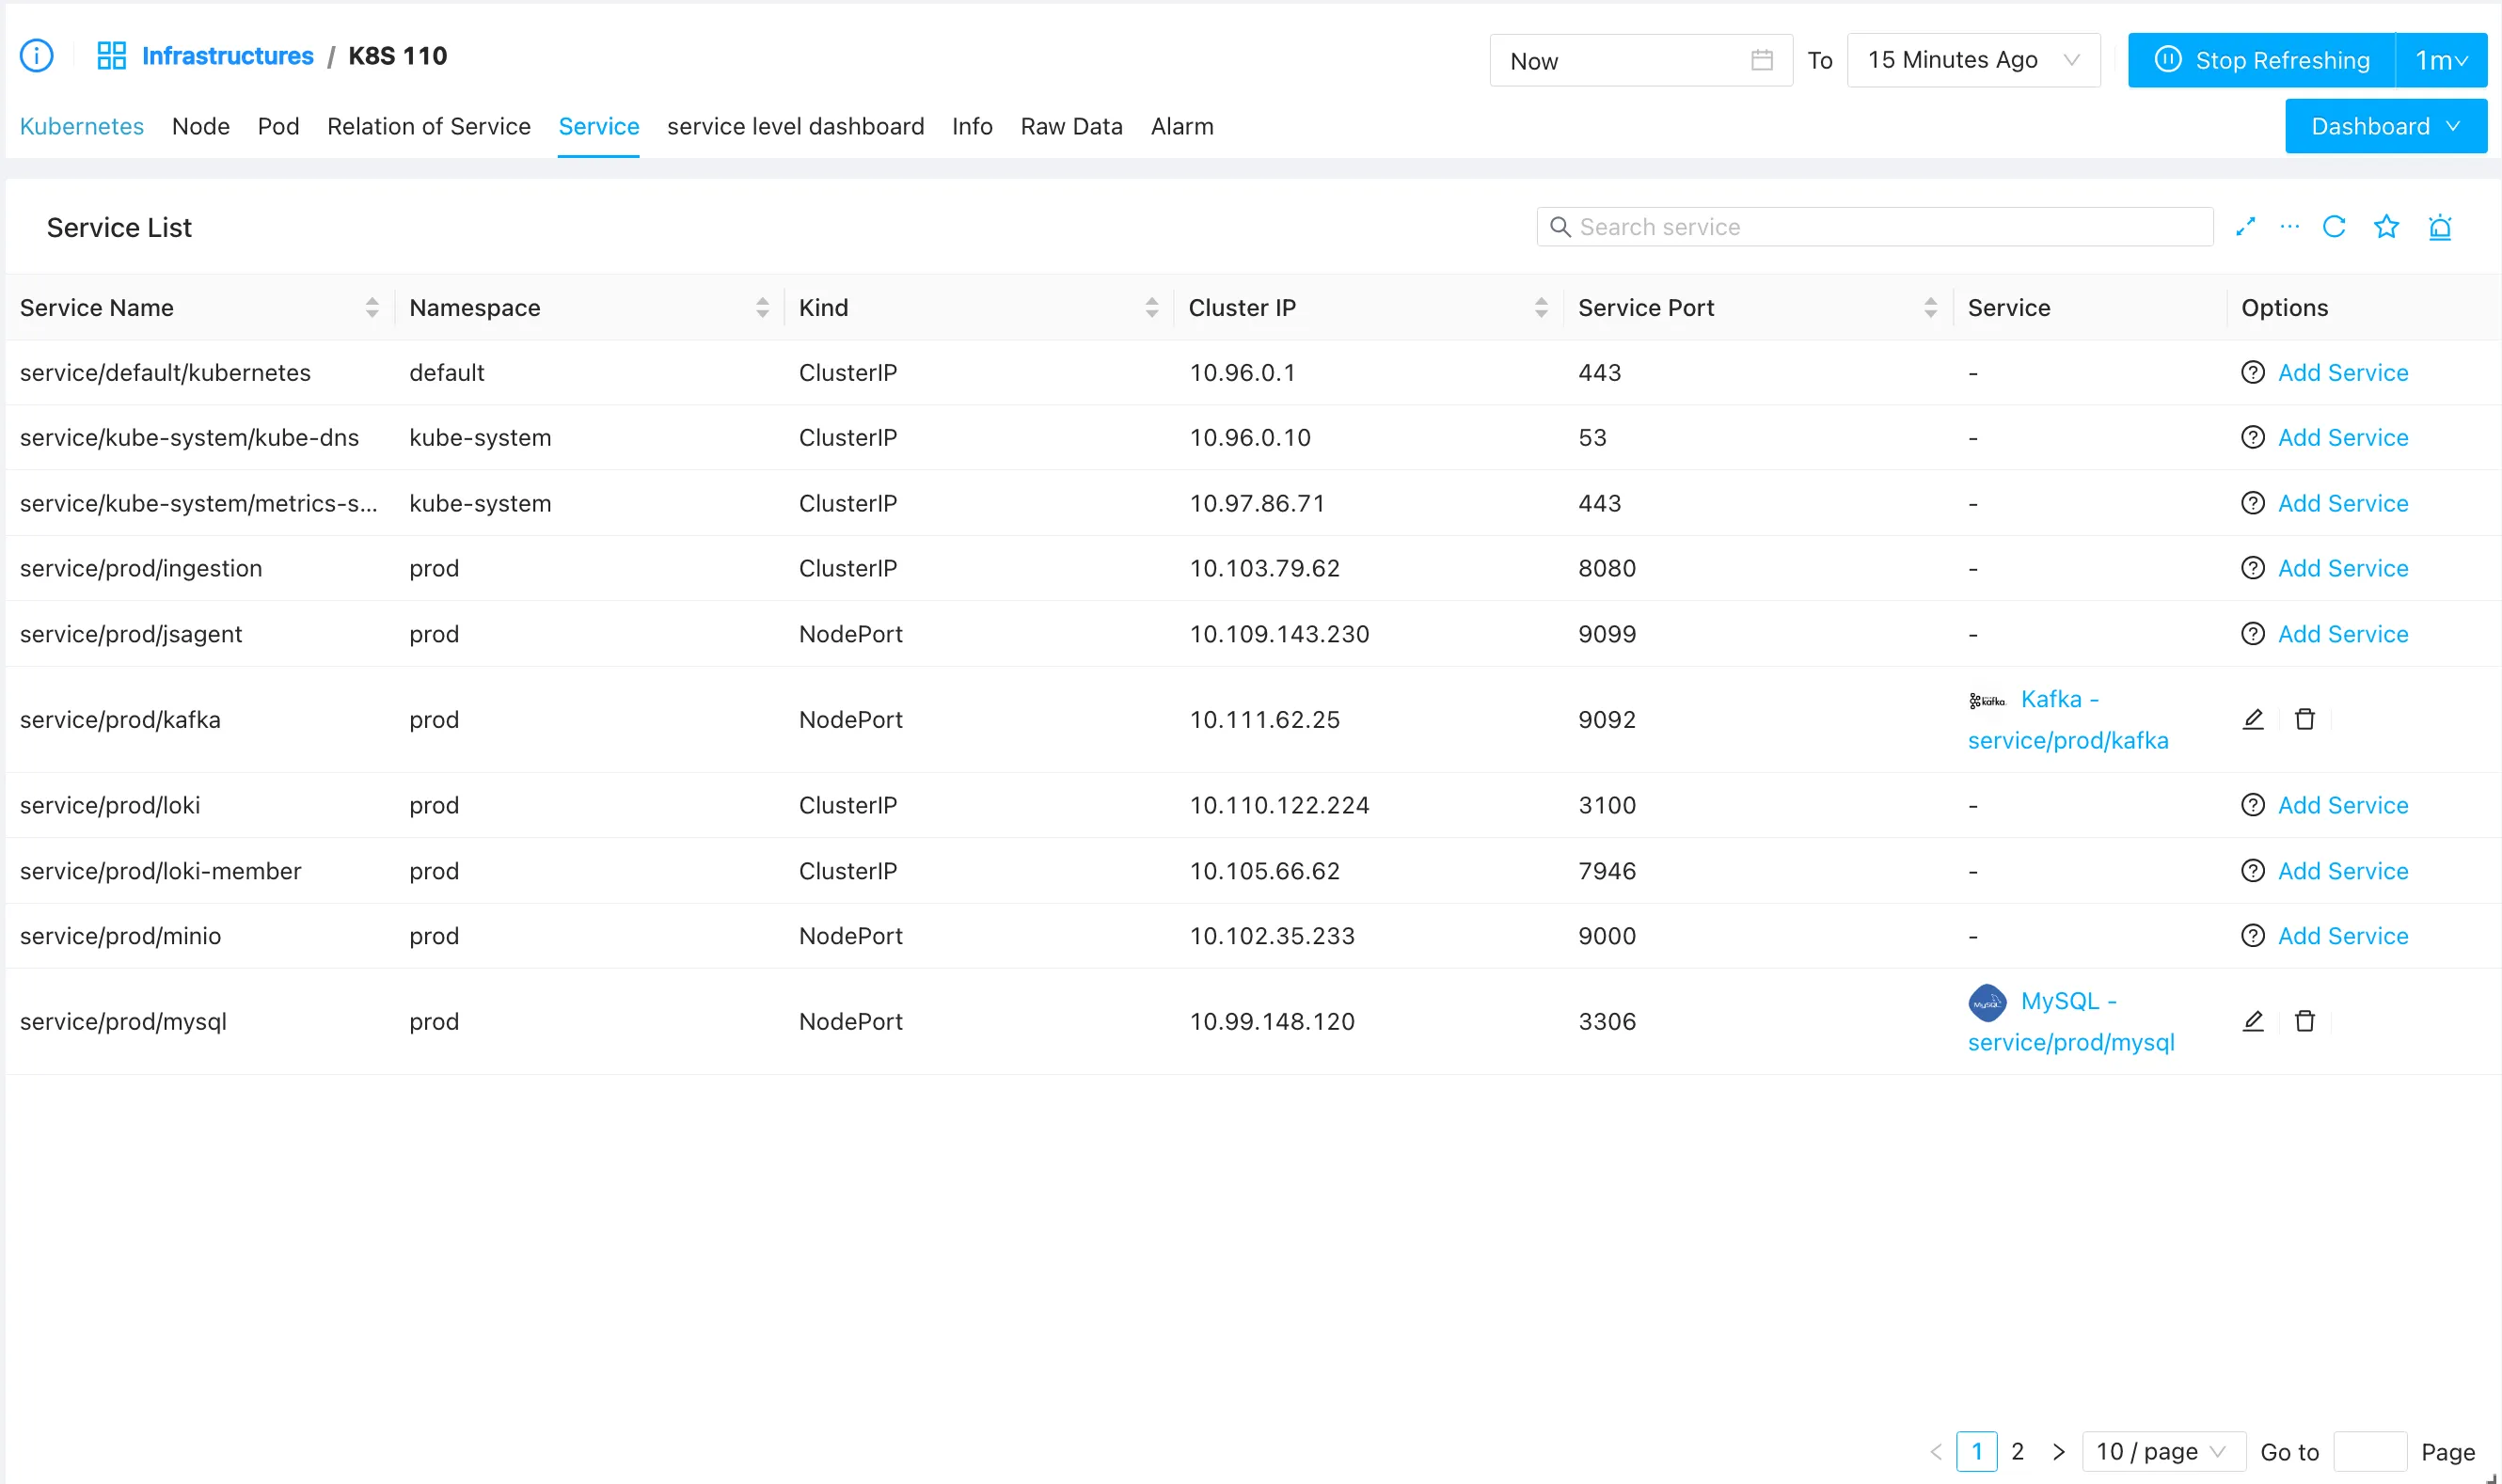
If a service is not currently monitored, an Add Service button will appear next to it. Clicking this button lets you select a matching plugin to start monitoring that application service.
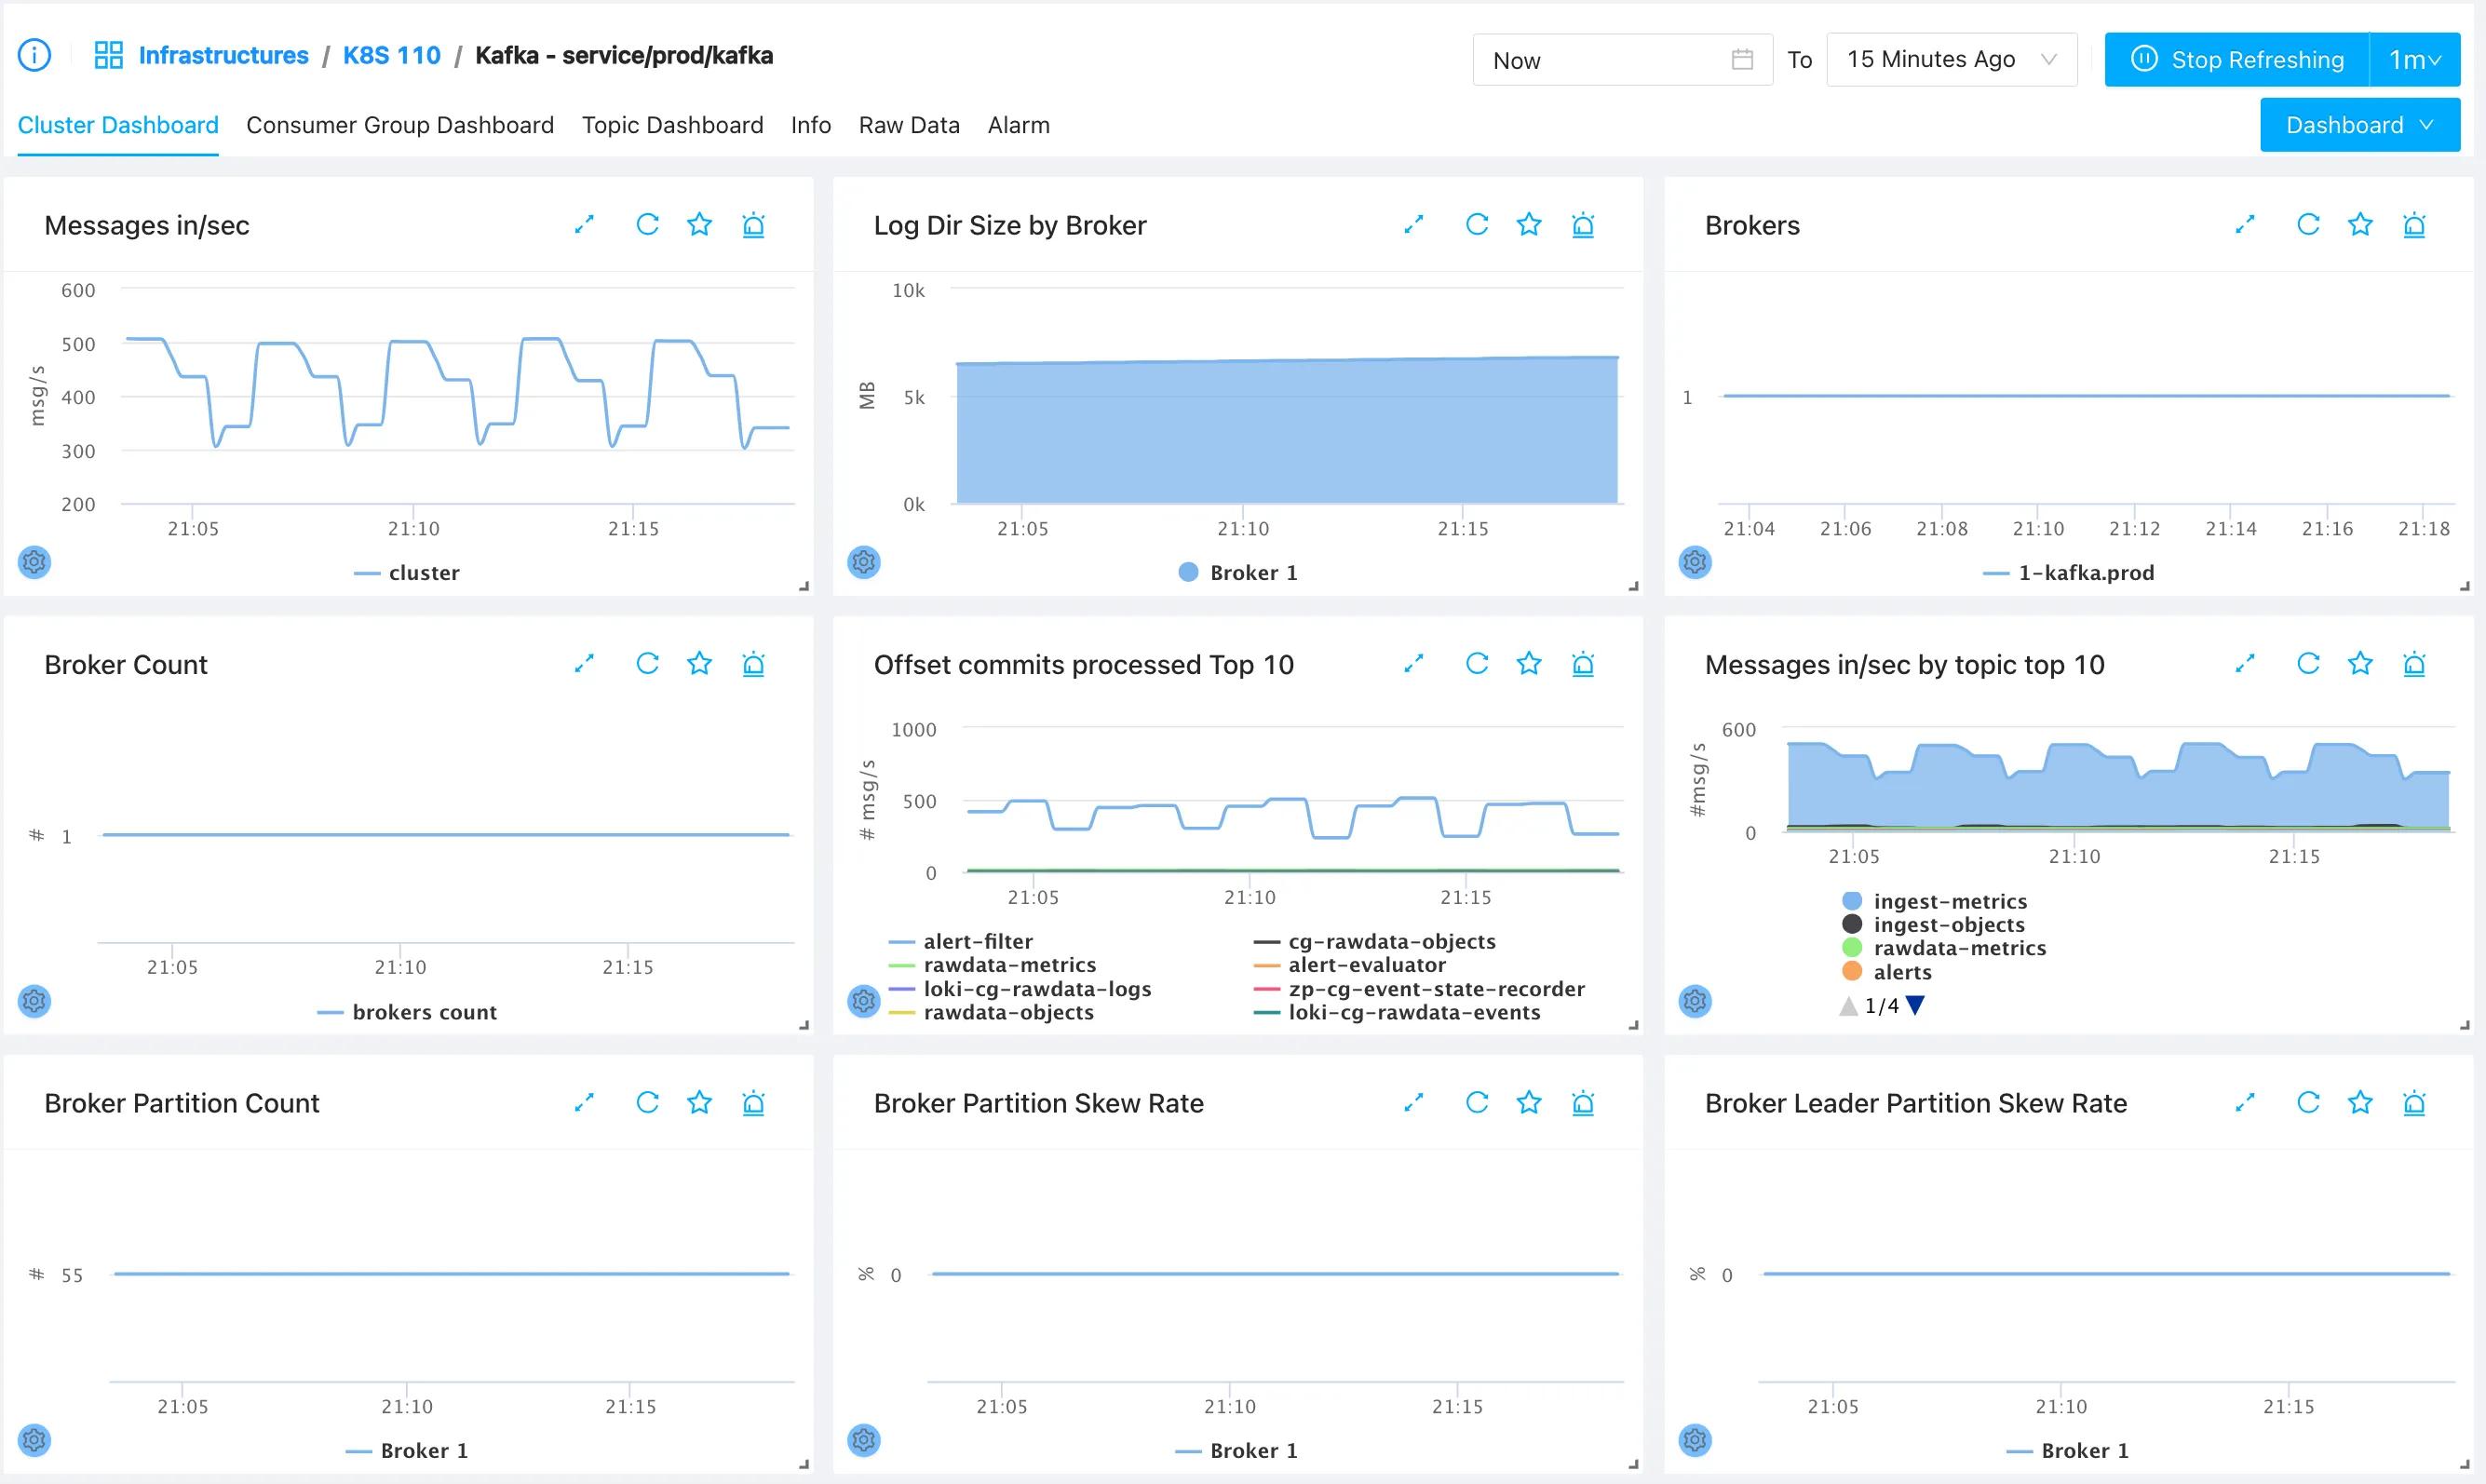
If a service is already monitored, a link to the corresponding monitoring service will be listed under the Service column. Clicking the link will navigate you to the dedicated dashboard for that service. For example, clicking the monitored Kafka service in the list opens its application dashboard:
Relation of Service
The Relation of Service view maps the traffic and communication paths between services and namespaces. You can apply custom groupings or filters to visualize service-to-service dependencies and identify data exchange paths.