HTTP Monitoring
HTTP Monitoring
HTTP/HTTPS is the foundational protocol of modern web services. ZoomPhant’s HTTP Monitoring allows you to track web server availability, performance, and SSL certificate status in seconds.
Create HTTP Monitoring
To configure HTTP monitoring, select the HTTP Checker plugin from the plugin library. You will be prompted to configure the following parameters:
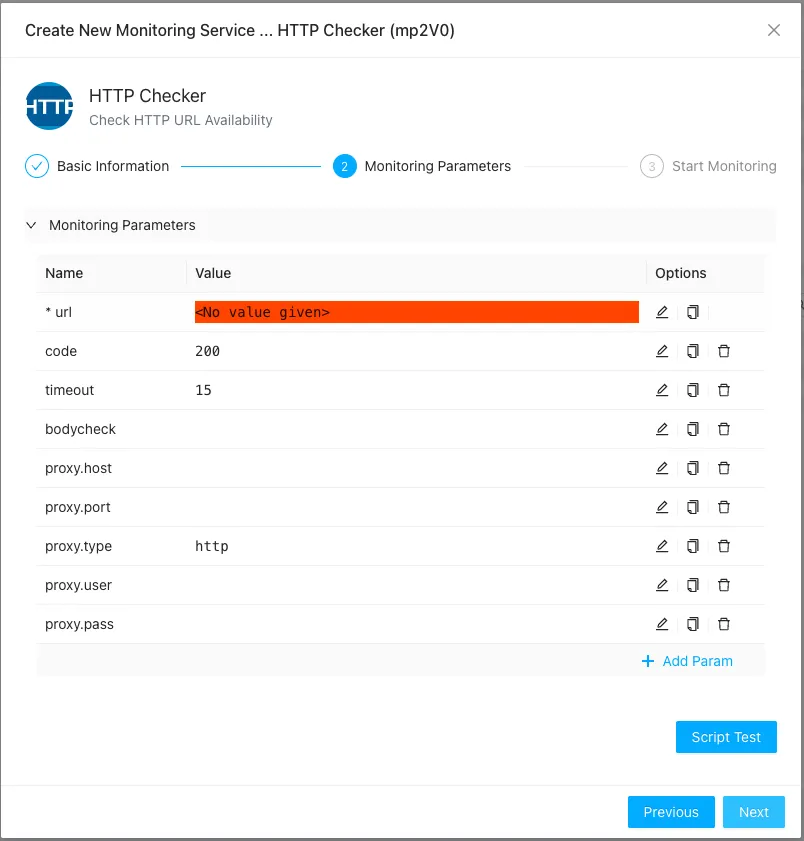
- url: The destination URL to check (e.g.,
https://example.com/api/health). This is the only required parameter and defaults to aGETrequest. - code: The expected HTTP response status code. Defaults to
200. - timeout: The query timeout in seconds. Defaults to
15seconds. - bodycheck: (Advanced) A JSON object defining rules to validate the HTTP response body (e.g., checking JSON or XML paths). The JSON object should contain the following fields:
- format: The format of the response body. Supported values:
jsonorxml. - path: The query path to validate (JSONPath or XPath depending on the format).
- value: The expected value, evaluated as a string.
- op: The comparison operator. Supported values:
equal,notEqual,contain,notContain,exist,notExist,match, ornotMatch.
- format: The format of the response body. Supported values:
- proxy.host / proxy.port: The IP/hostname and port of a proxy server, if required to route the request.
- proxy.user / proxy.pass: Username and password for proxy authentication, if required.
- proxy.type: The proxy protocol type. Defaults to
HTTP.
Understanding HTTP Checker Metrics
After adding the service, wait a few seconds for the initial collection cycle. Select the service from the services list to view the HTTP health dashboard:
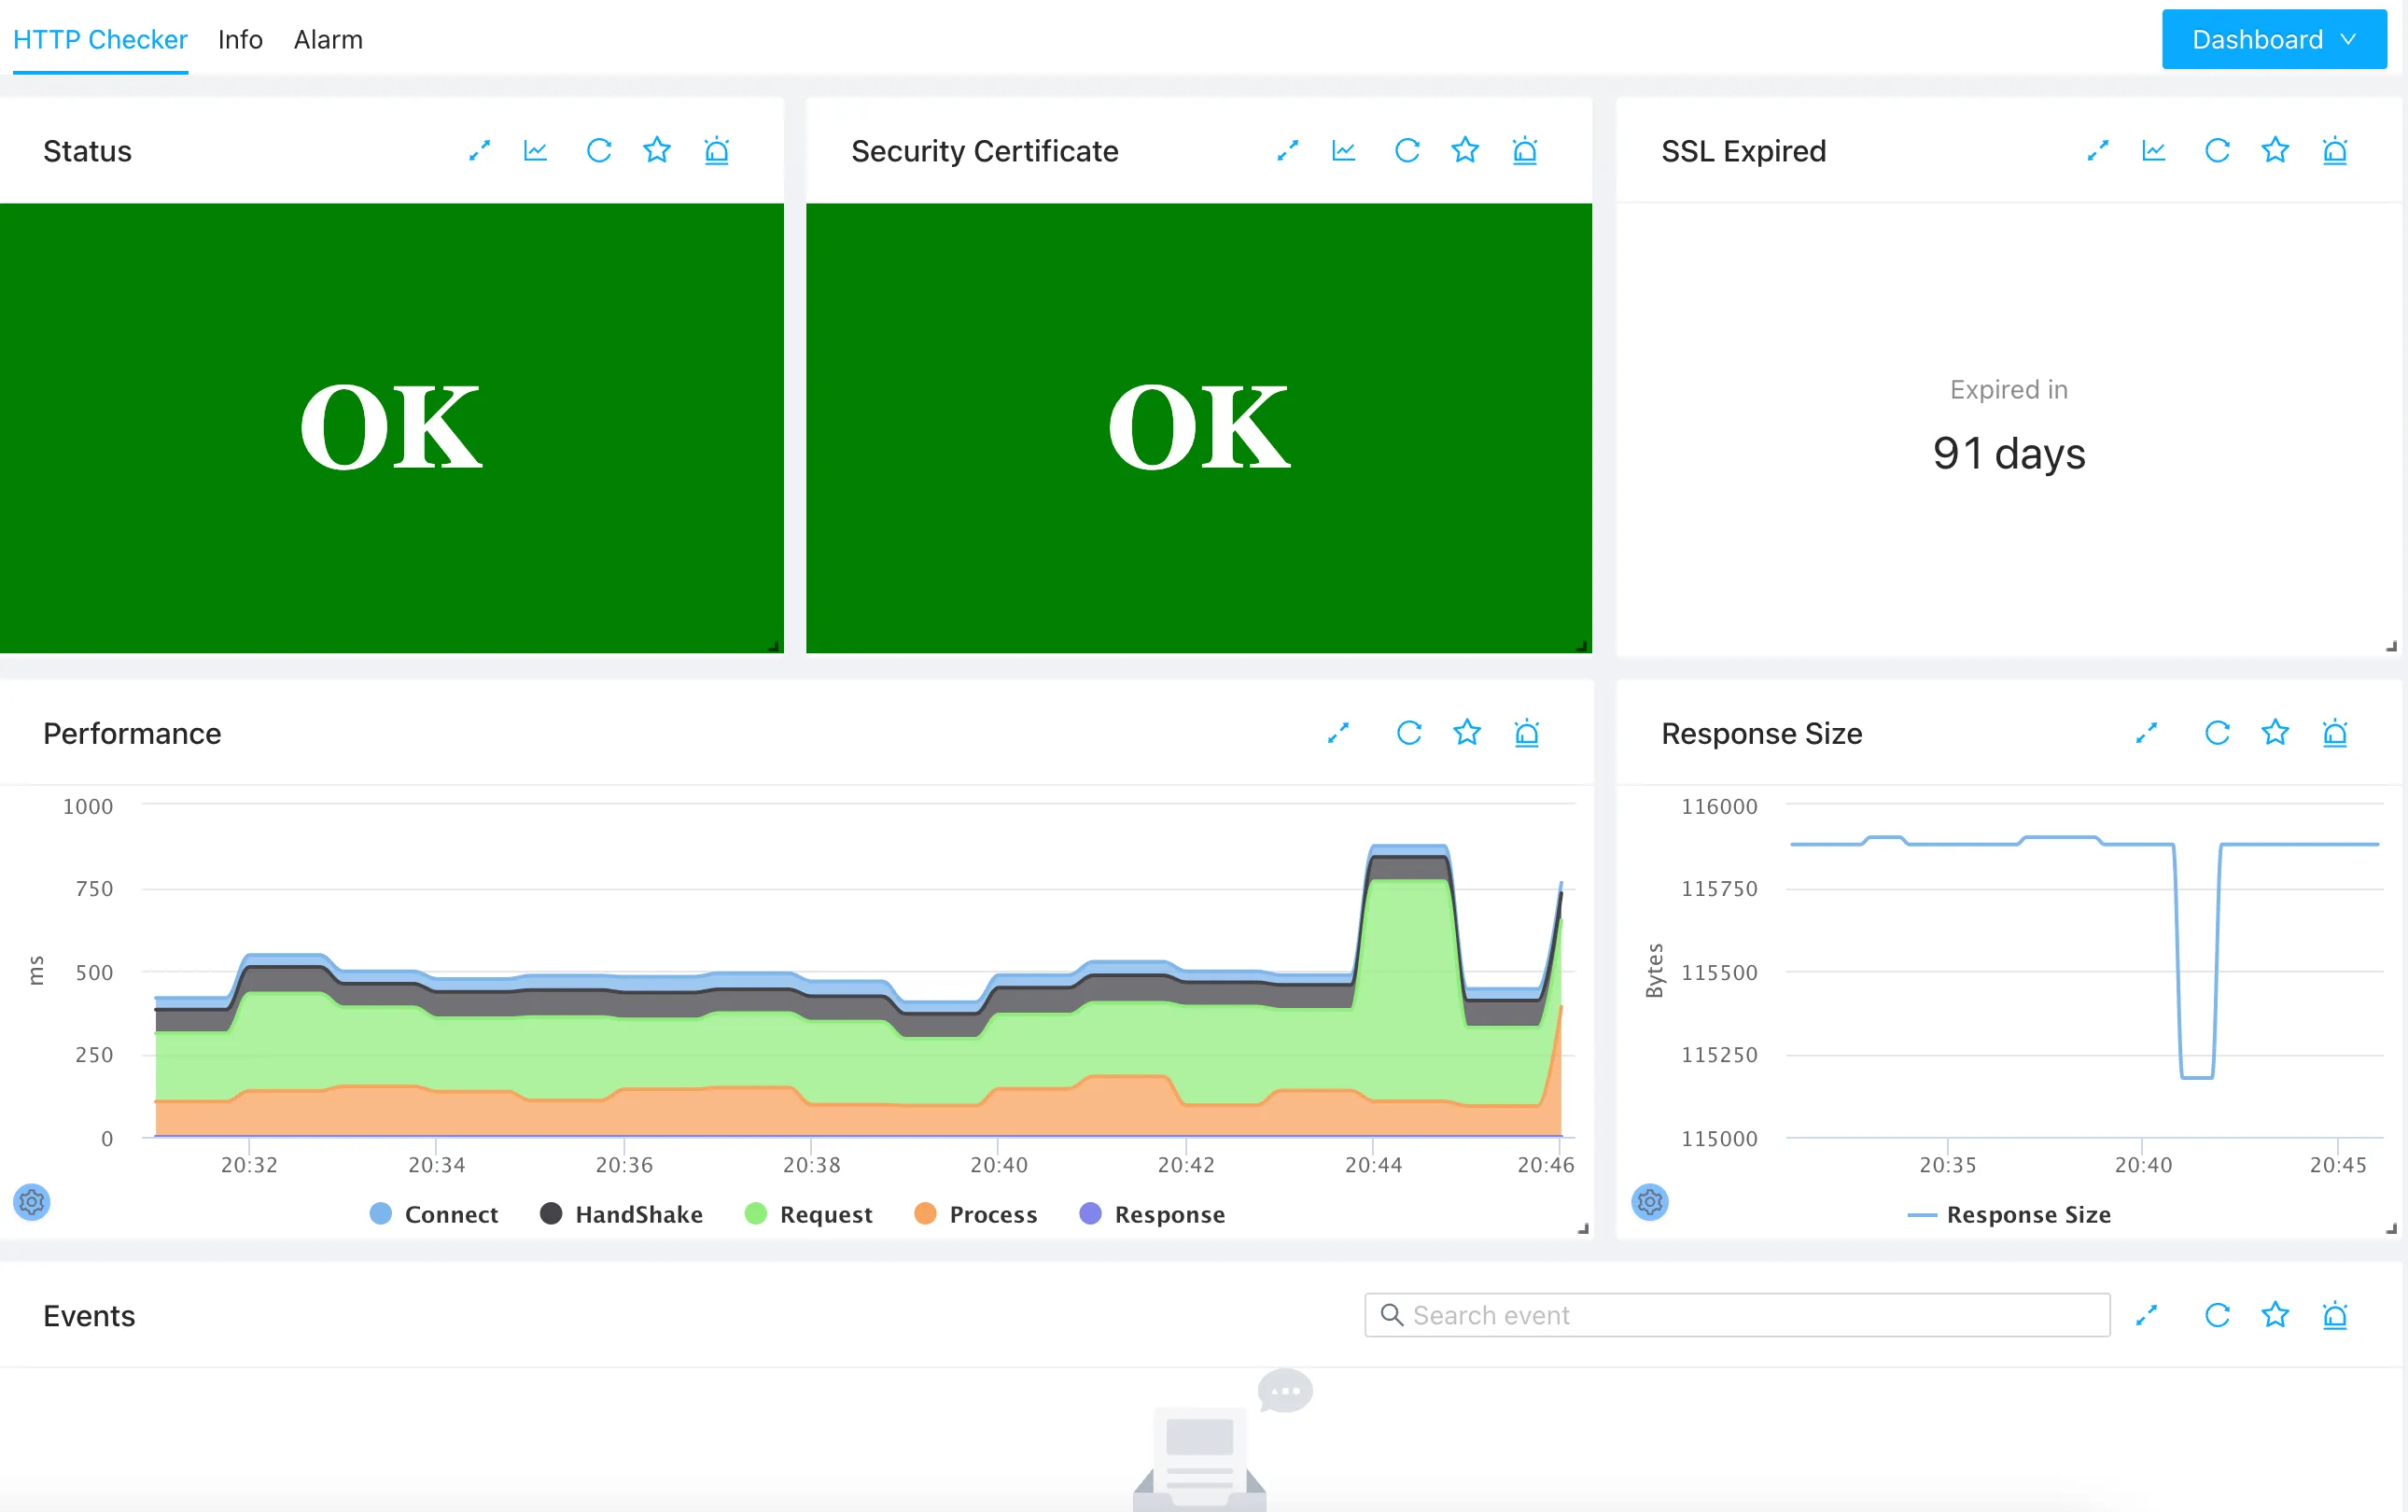
The dashboard highlights the following key widgets and latency phases:
- Overall Status: The Status widget displays a green
OKif the request succeeds and the response matches your expectations. If a check fails (e.g., connection timeout, incorrect status code, or failed body check), an orange or red error message describes the failure. - Security Certificate: For
HTTPSURLs, the Security Certificate widget monitors TLS handshake status. A greenOKis shown for valid certificates, while expired, self-signed, or mismatched certificates display orange or red error warnings. - SSL Expiration: The SSL Expired widget tracks the remaining days until the SSL/TLS certificate expires. You can configure alert thresholds to notify you before a certificate expires.
- Performance Metrics: The Performance and Response Size widgets track endpoint responsiveness. ZoomPhant breaks down HTTP request latency into detailed phases:
- Connect: Time taken to establish a TCP connection to the target server.
- Handshake: Time taken to complete the SSL/TLS handshake (HTTPS only).
- Request: Time taken to send the HTTP request payload to the server.
- Process: Server processing time (Time to First Byte, or TTFB) after receiving the request.
- Response: Time taken to download the full response body from the server.