Log Monitoring Use-cases
To help you understand the ZoomPhant Log Query Language, this guide walks through a concrete example of log processing and analysis. We will process Nginx access logs formatted as follows:
log_format combined '$remote_addr - $remote_user [$time_local] '
            '"$request" $status $body_bytes_sent '
            '"$http_referer" "$http_user_agent"';
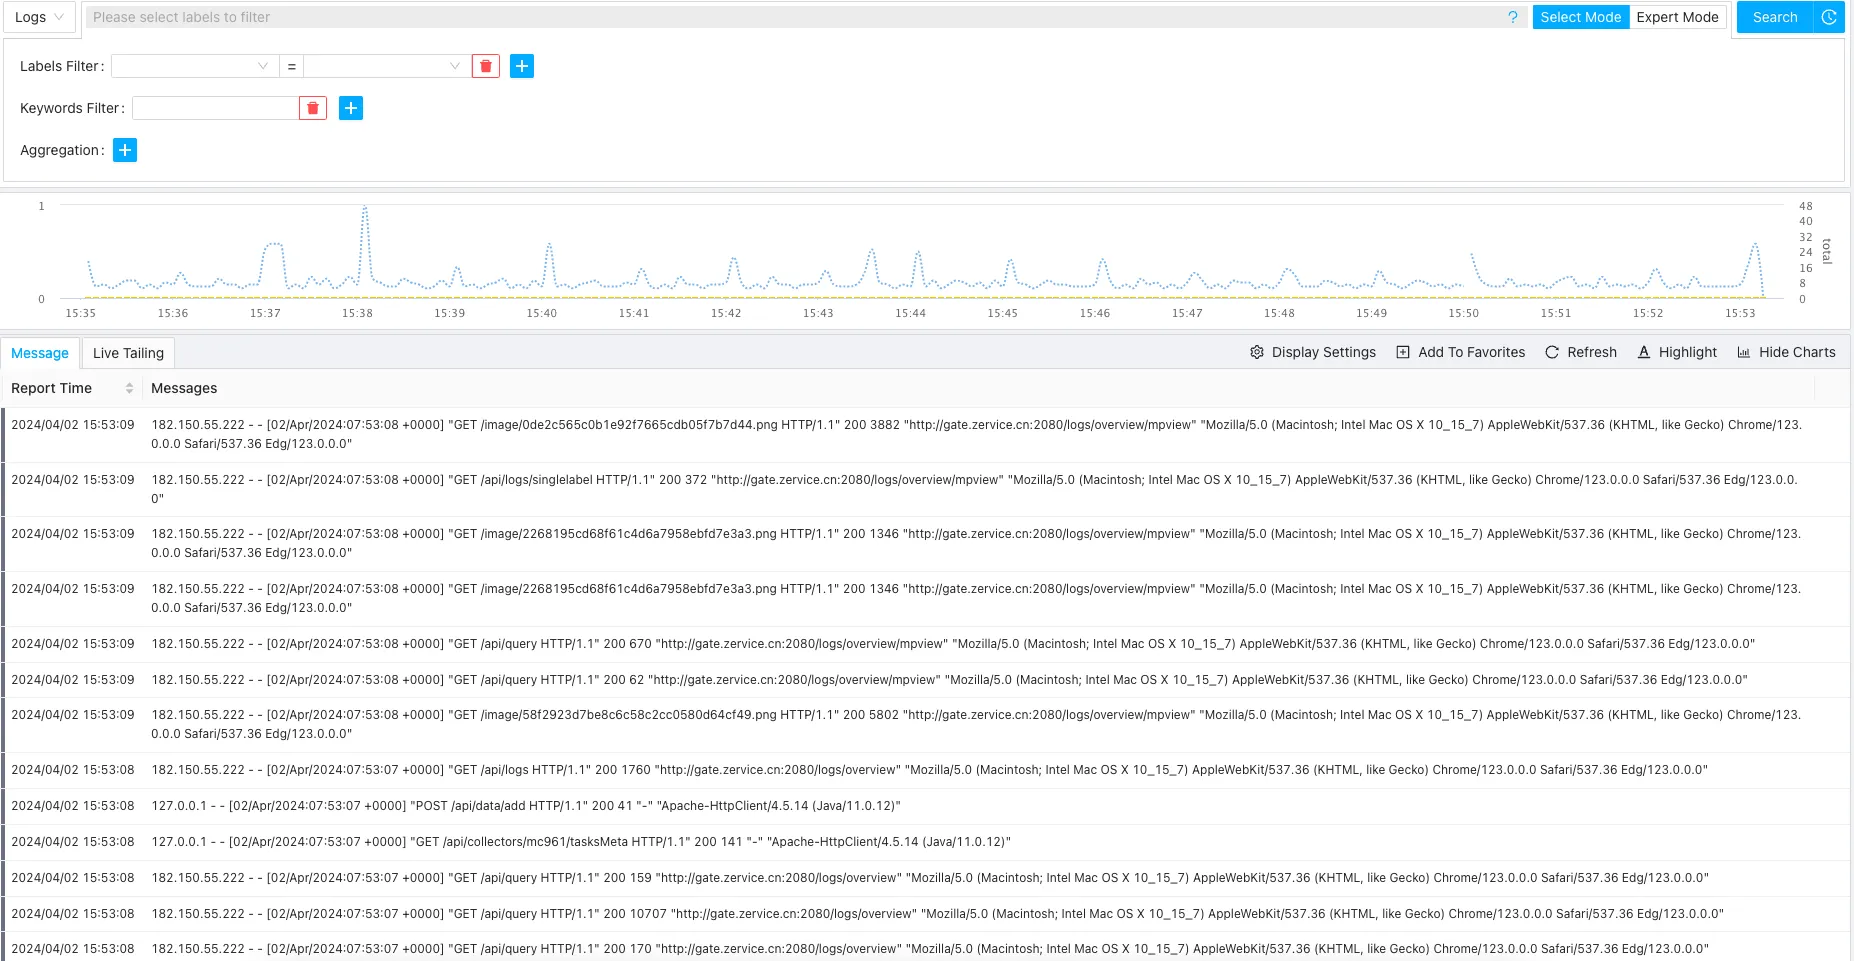
Before any processing, the raw logs collected from Nginx look like this:
Filtering Logs
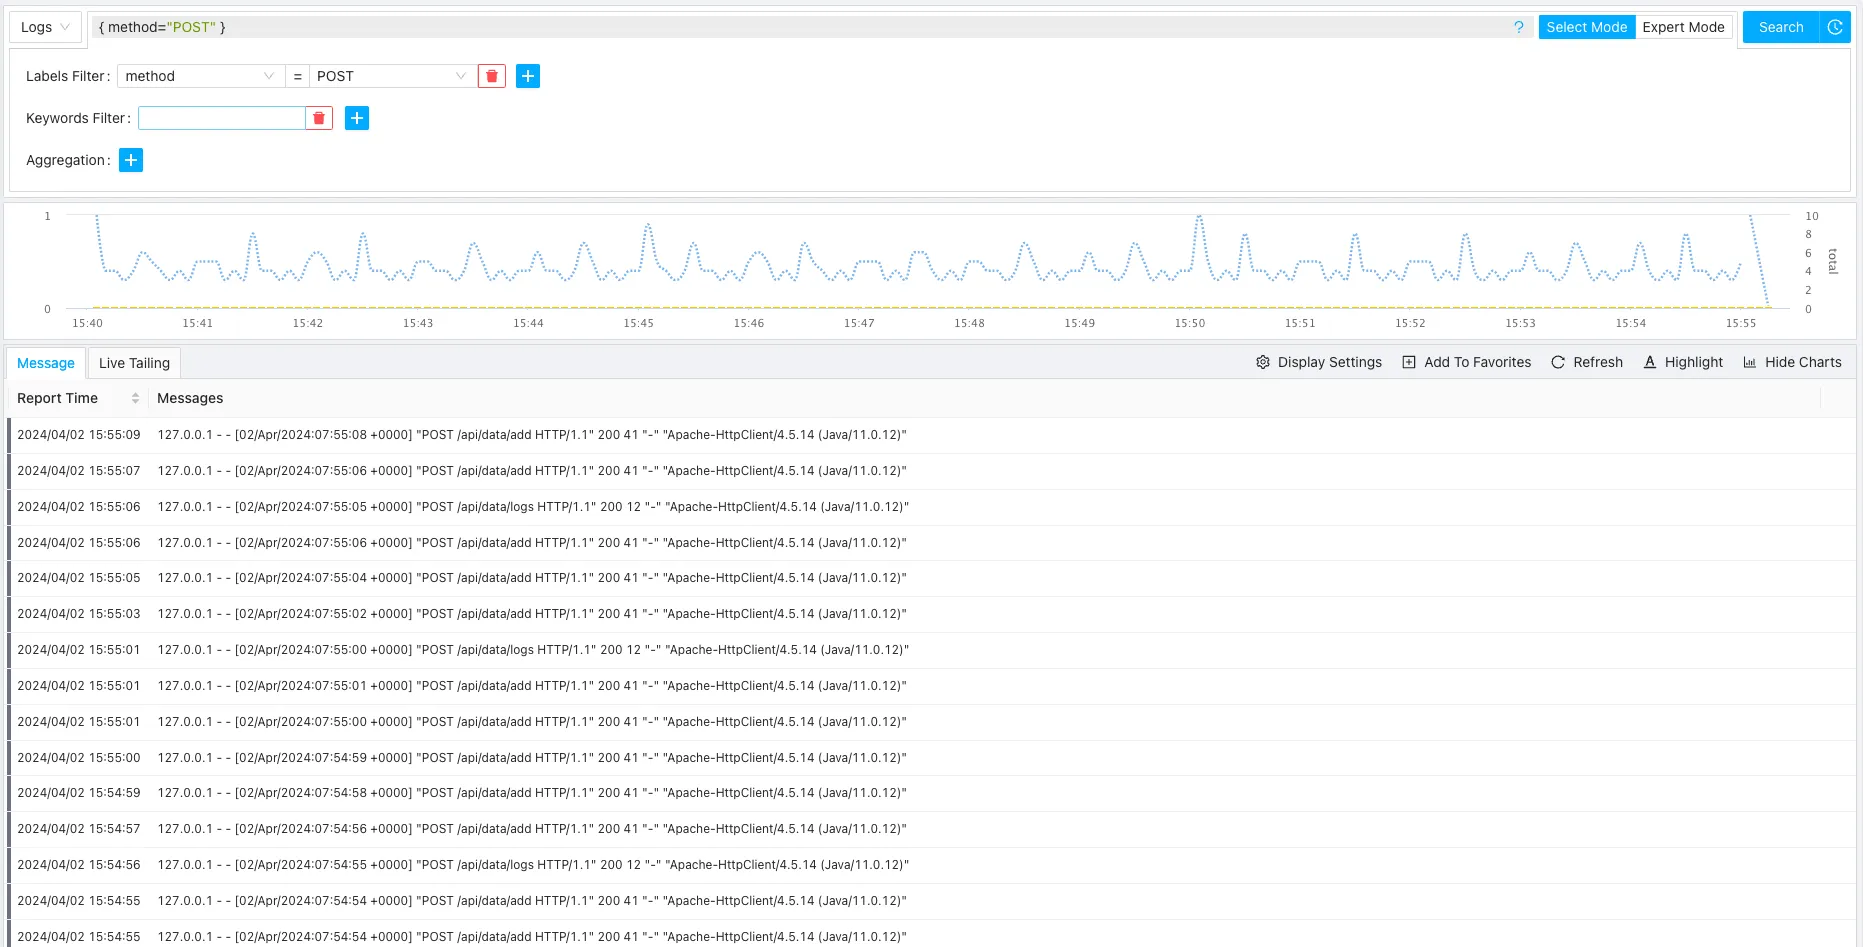
To filter and display only POST requests, we can write the following query:
{method="POST"}Applying the filter yields the following output:
To filter out non-POST requests instead, use the inequality operator:
{method!="POST"}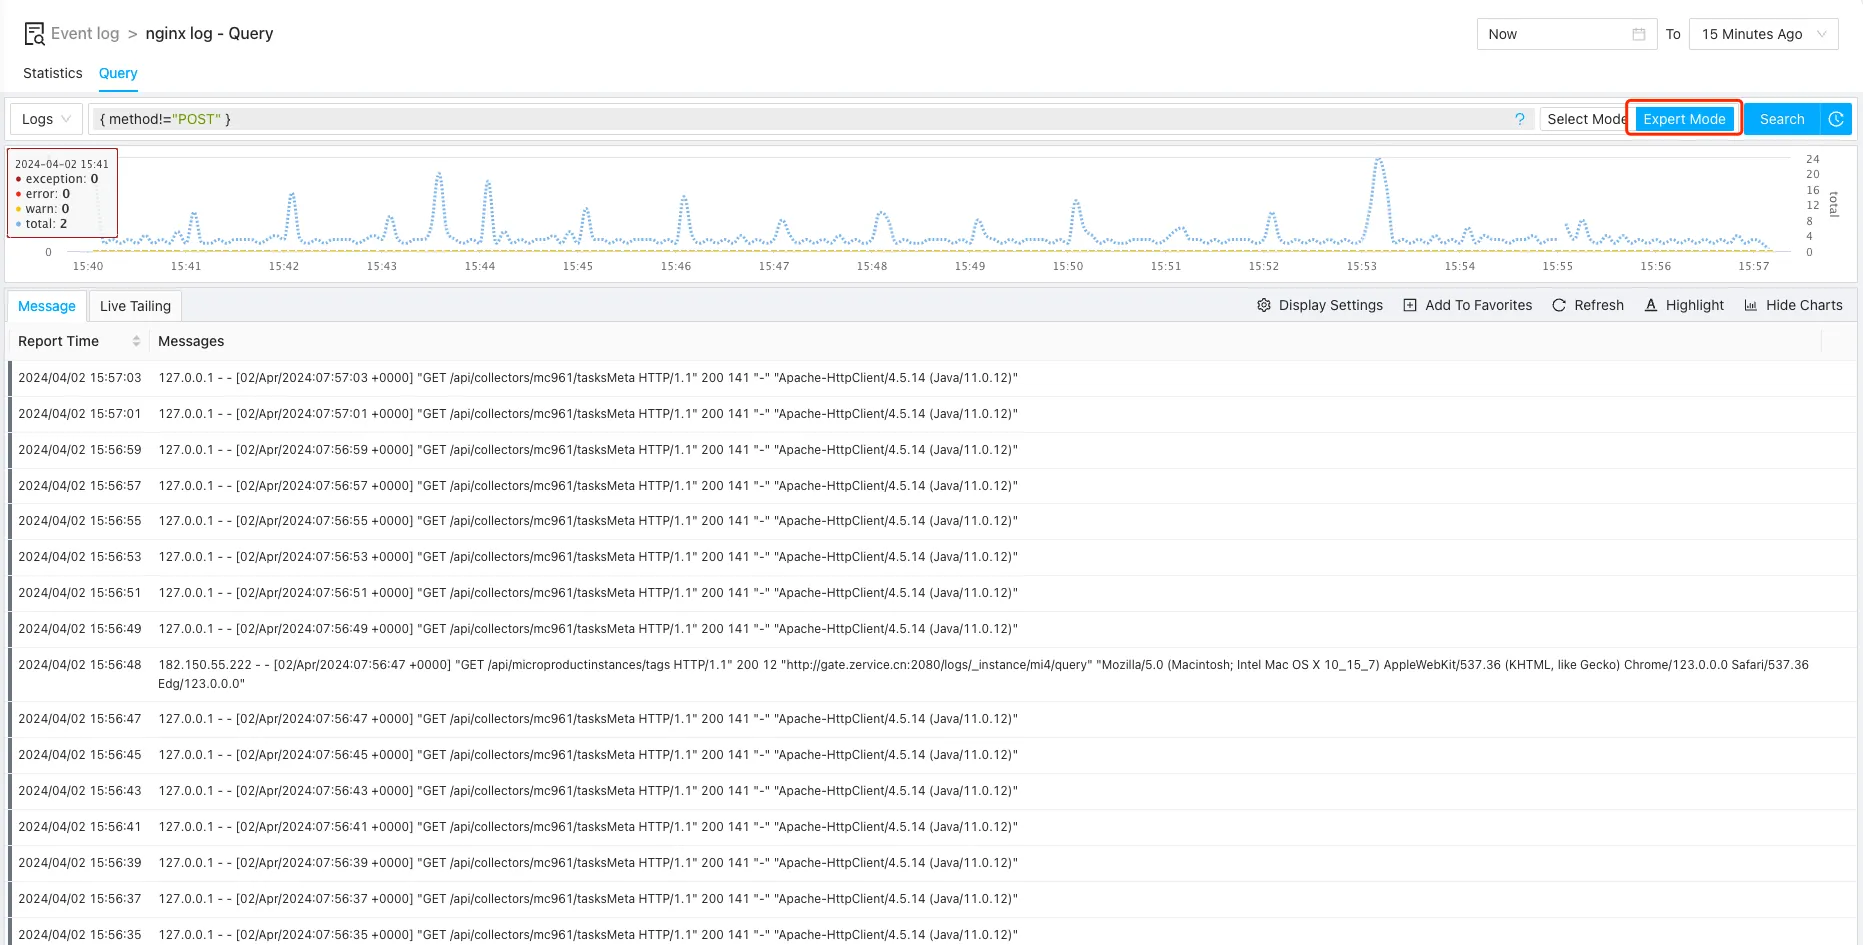
Note: Switch the log viewer to Expert Mode to manually enter query statements, as Selection Mode is limited to basic filters.
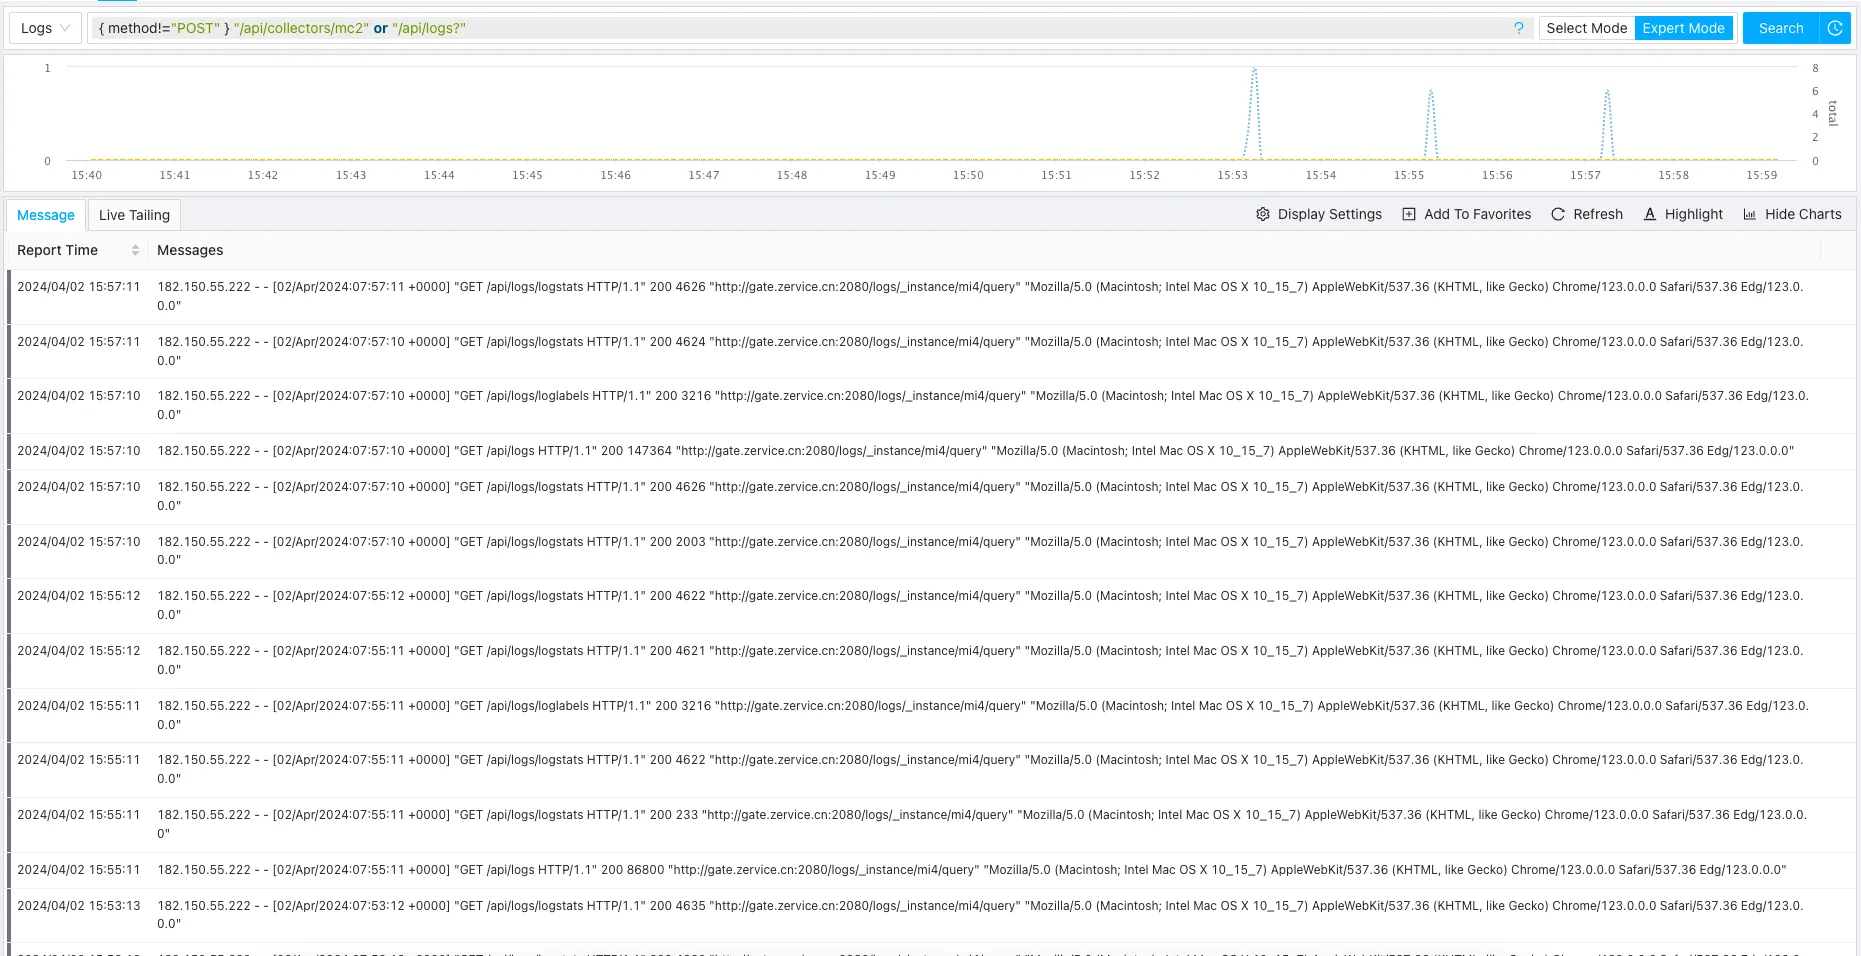
Continuing with the example, let’s filter the logs to target specific API endpoints:
{method!="POST"} "/api/collectors/mc2" or "/api/logs?"The output is updated accordingly:
Using Log Processing Functions
By filtering the raw logs to a smaller subset, we can now apply processing functions to:
- Dynamically extract structured information from log text.
- Perform secondary filtering and metric calculations on the extracted data.
Extracting More Labels
By default, raw Nginx logs are unstructured text and lack discrete labels for IP addresses, HTTP methods, or referrers:
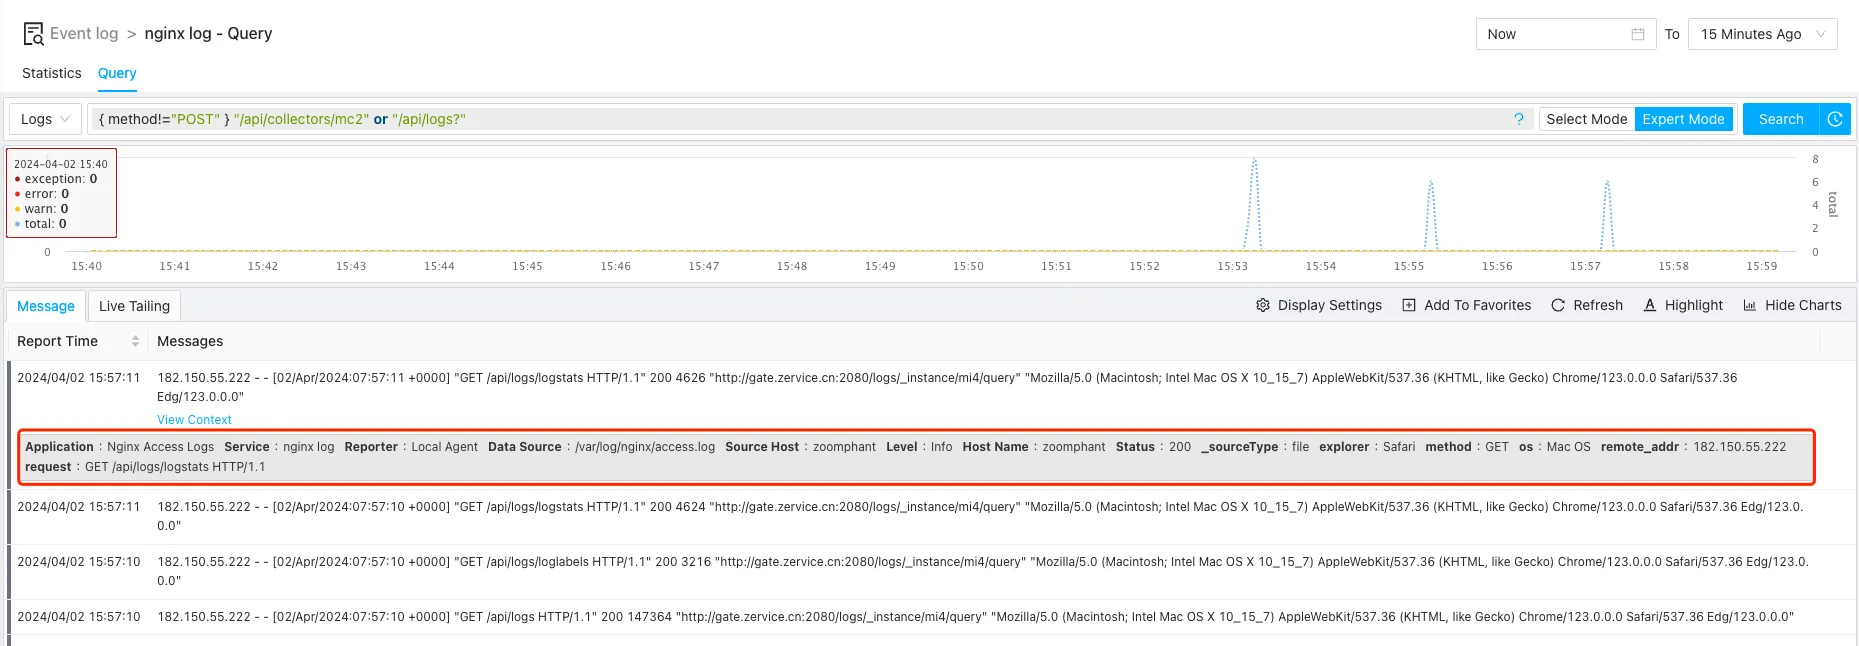
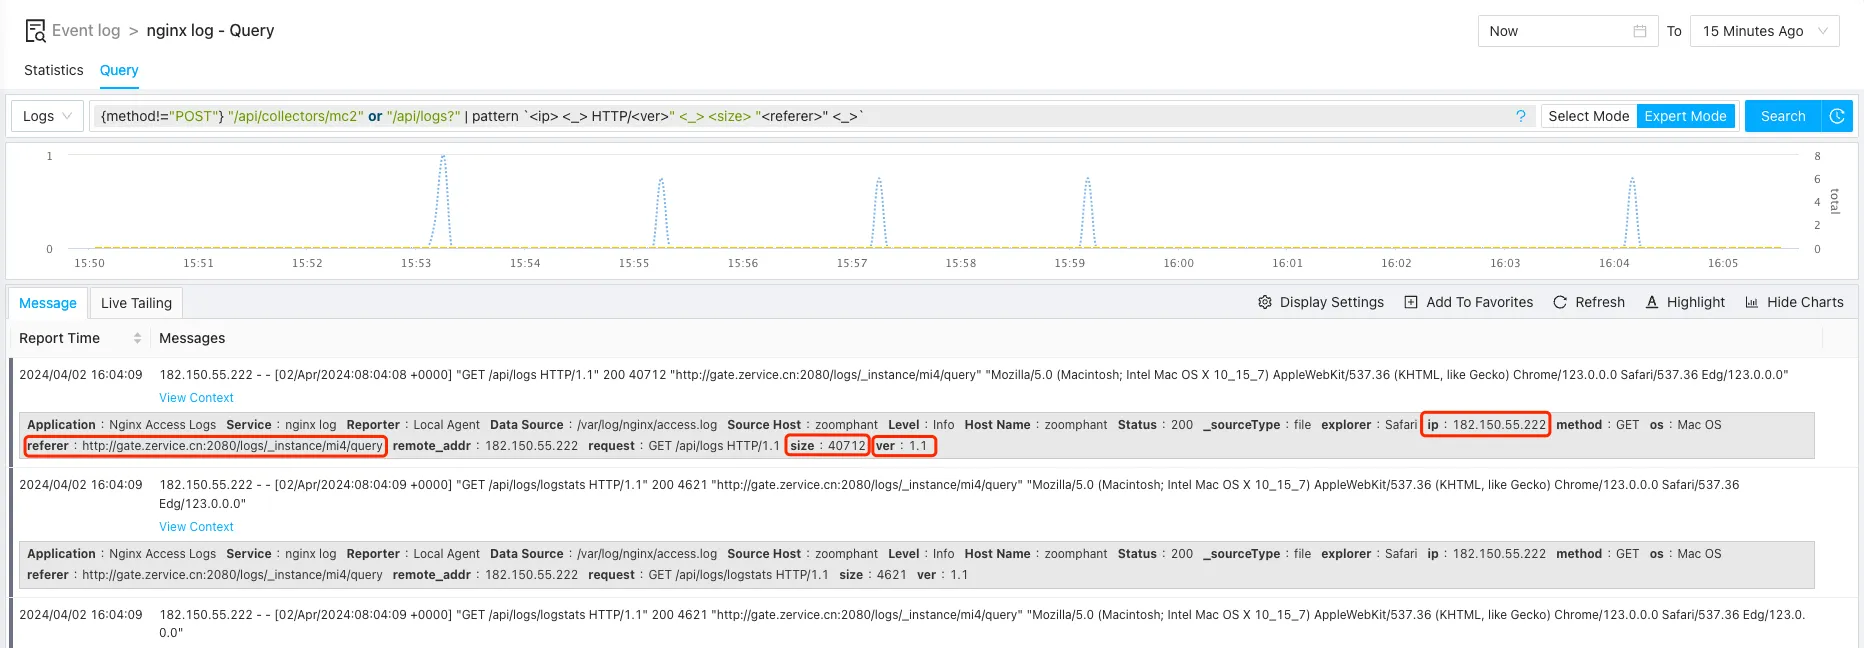
To perform advanced analysis, we can extract the following fields from the log lines:
- ip: The client IP address sending the request.
- ver: The HTTP protocol version.
- size: The size of the server response in bytes.
- referer: The referring page URL.
We can achieve this using the pattern function:
{method!="POST"} "/api/collectors/mc2" or "/api/logs?" | pattern `<ip> <_> HTTP/<ver>" <_> <size> "<referer>" <_>`Note: We enclose the pattern in backticks (ticks) to allow double quotes within the pattern argument itself.
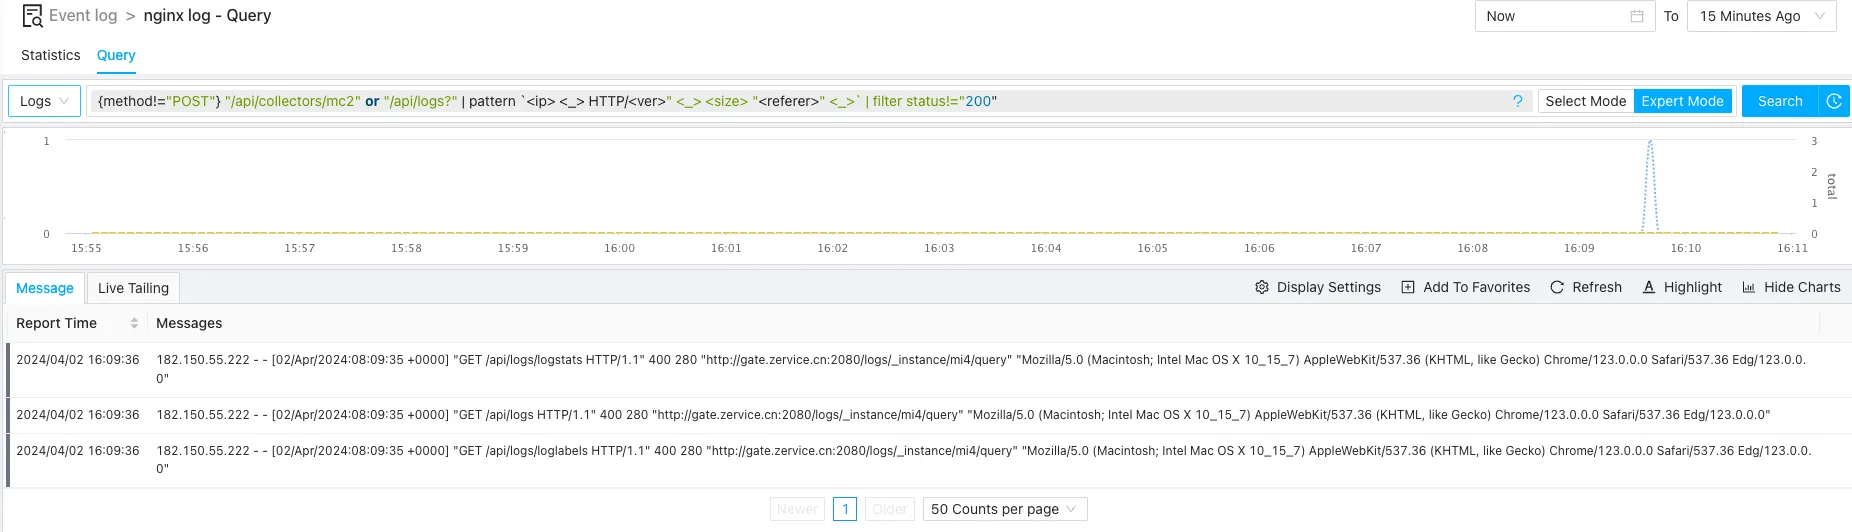
To find unsuccessful requests (where the status code is not 200), we chain a secondary filter stage to our pipeline:
{method!="POST"} "/api/collectors/mc2" or "/api/logs?" | pattern `<ip> <_> HTTP/<ver>" <_> <size> "<referer>" <_>` | filter status!="200"The filtered results are displayed:
Vectorizing Logs and Charts
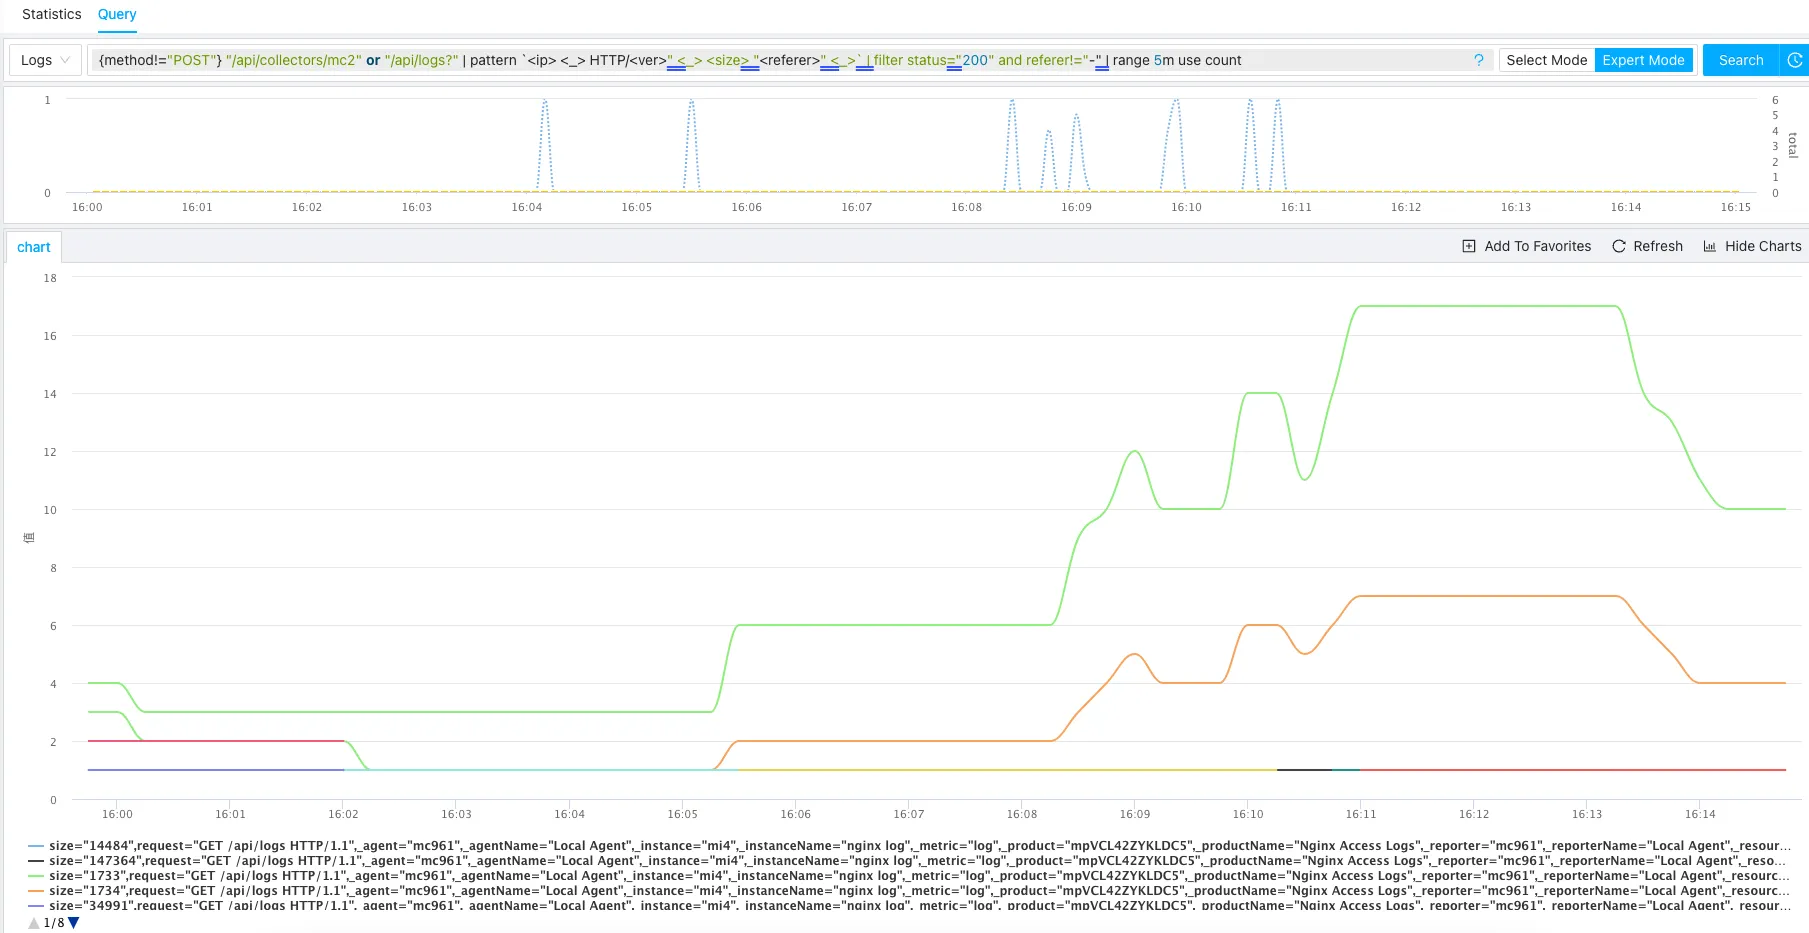
To visualize the trend of successful requests over time at 5-minute intervals, we vectorize the logs using the range function:
{method!="POST"} "/api/collectors/mc2" or "/api/logs?" | pattern `<ip> <_> HTTP/<ver>" <_> <size> "<referer>" <_>` | filter status="200" and referer!="-" | range 5m use countThe output is rendered as a line chart:
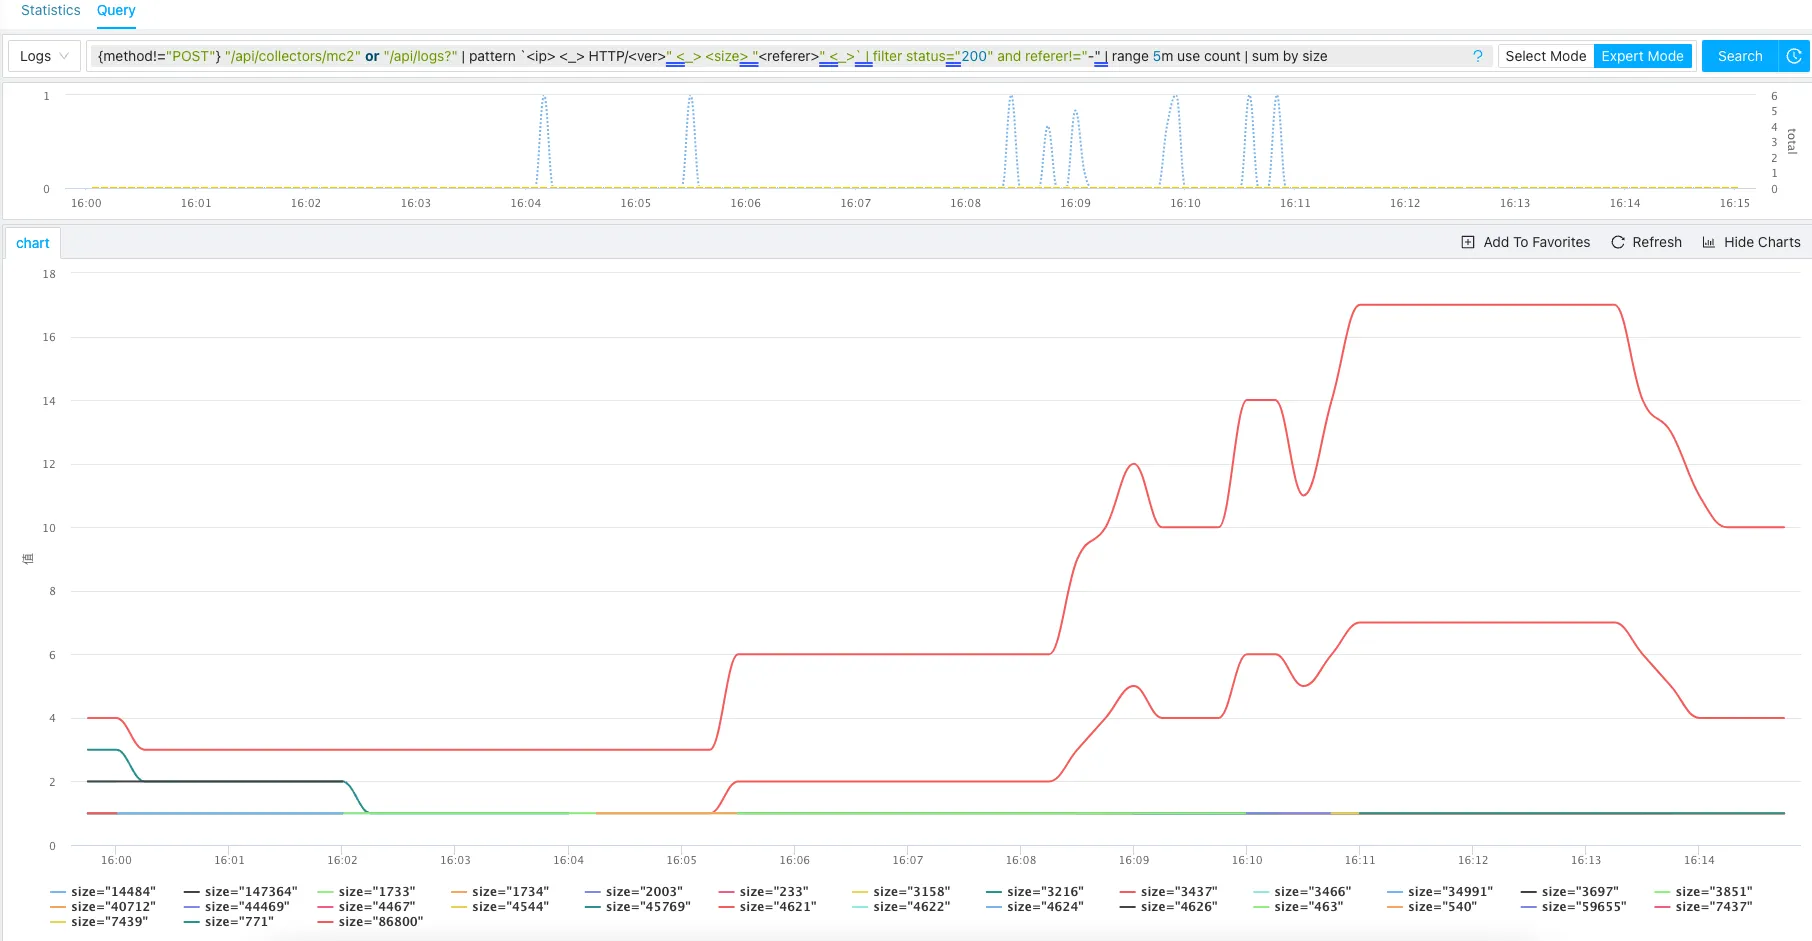
We can calculate statistics by response size by aggregating the counts using the sum function:
{method!="POST"} "/api/collectors/mc2" or "/api/logs?" | pattern `<ip> <_> HTTP/<ver>" <_> <size> "<referer>" <_>` | filter status="200" and referer!="-" | range 5m use count | sum by sizeThe output displays metrics grouped by size:
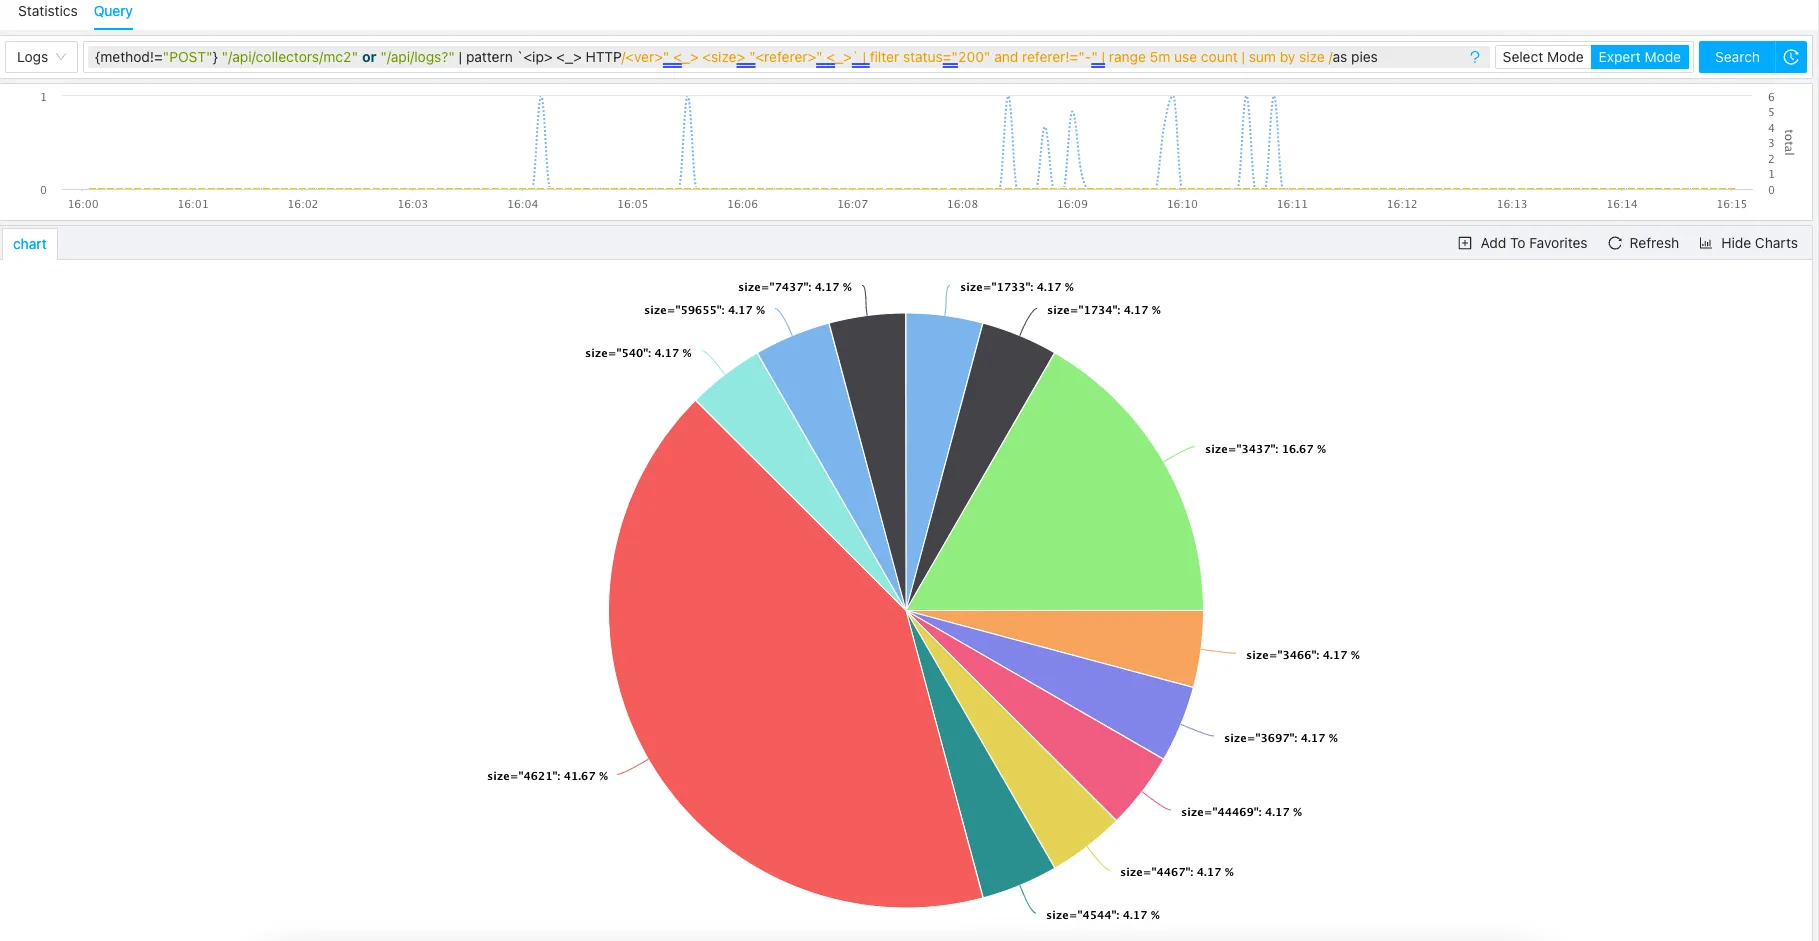
To visualize the current distribution of response sizes as a pie chart, add the /as pies display option:
{method!="POST"} "/api/collectors/mc2" or "/api/logs?" | pattern `<ip> <_> HTTP/<ver>" <_> <size> "<referer>" <_>` | filter status="200" and referer!="-" | range 5m use count | sum by size /as piesThe data is rendered as a pie chart: