Route Monitoring
Route Monitoring
Traceroute is an indispensable tool for network administrators to diagnose routing paths and locate network latency. ZoomPhant’s Route Checker plugin makes routing path analysis accessible and easy to monitor continuously.
Create Route Monitoring
To monitor the network path to a target host, select the Route Checker plugin from the plugin library as described in Add Monitor Service. You will be prompted to configure the following parameters:
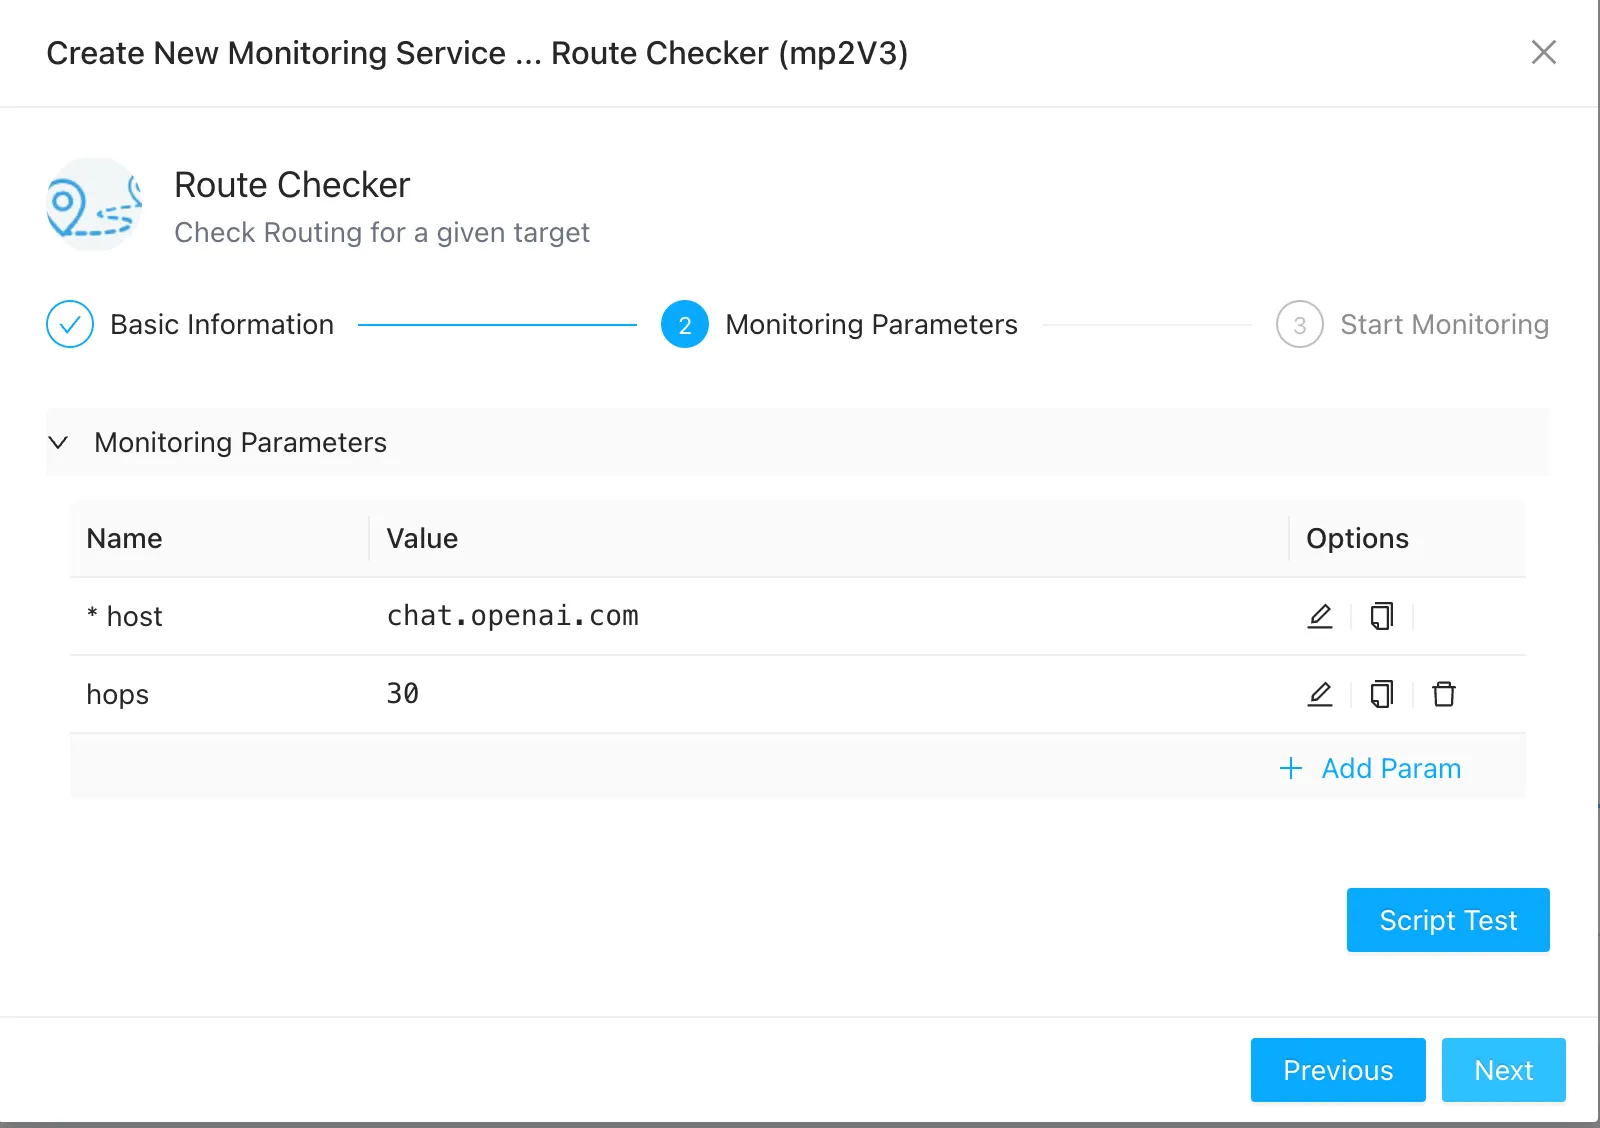
- host: The IP address or domain name of the destination target (required).
- hops: The maximum number of network hops (TTL) to allow. If the target requires more hops to be reached, the check will fail.
Once you have configured the parameters, click Test to run a manual traceroute, and then click Finish to save the service.
Understanding Route Checker Metrics
After adding the service, select it from the service list to view the routing path dashboard:
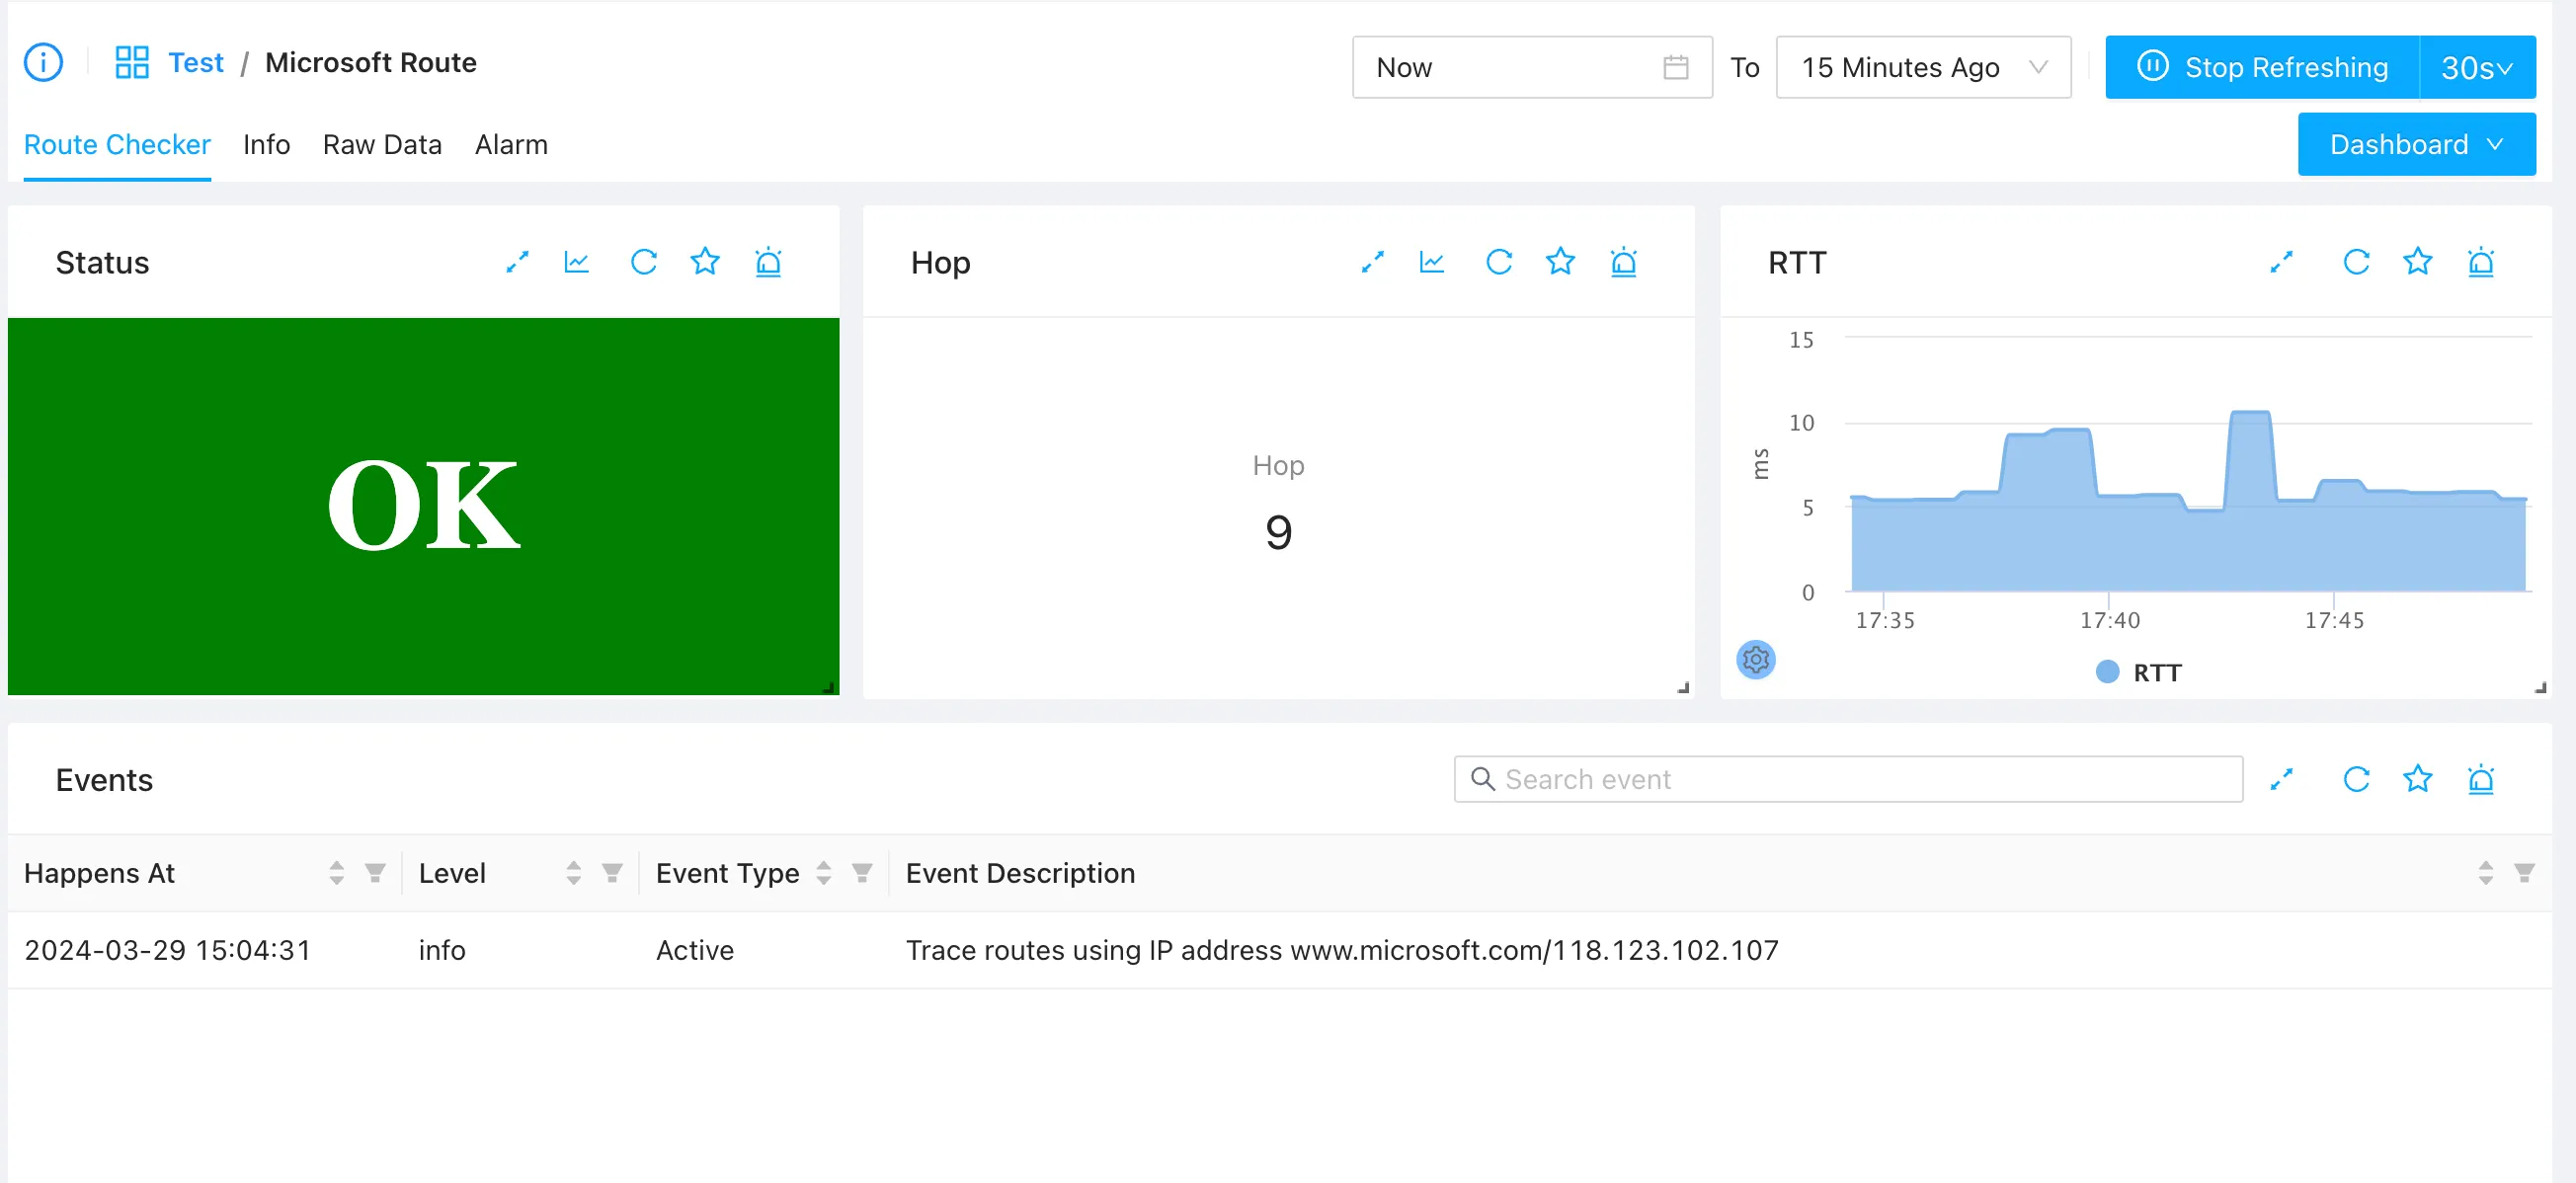
The dashboard displays the following key routing metrics and states:
- Status: Displays
OK(green) if the target is reachable. If the target cannot be reached, the status describes the last known network segment:- Intranet: Responses were received from several hops, but all responding routers use private/local IP addresses (no public Internet routing).
- Internet: Responses were received, and at least one responding router has a public IP address, but the final target host could not be reached.
- Invalid Domain: The destination domain name could not be resolved by the configured DNS.
- Hops: The number of network hops taken to reach the destination target. If unreachable, this is recorded as
0. - RTT (Round-Trip Time): The network latency to the target host in milliseconds.
- Events: Lists significant routing events, such as changes in the resolved target IP address or routing path changes.