Prometheus Template Plugin
Prometheus is a widely adopted open-source monitoring tool. Many teams build custom observability solutions by combining Prometheus exporters with Grafana dashboards.
However, operating a self-hosted Prometheus and Grafana stack involves significant maintenance overhead for database scaling, configuration, and infrastructure management. ZoomPhant’s Prometheus Template Plugins eliminate this overhead. By creating a custom plugin from a template and importing existing Grafana dashboards, you can migrate Prometheus-based monitoring setups into ZoomPhant seamlessly.
This guide walks you through migrating an existing Prometheus monitoring setup into ZoomPhant in two steps:
- Create a custom plugin using the Prometheus Template.
- Import the corresponding Grafana dashboard.
Create a Custom Prometheus Monitoring Plugin
The Prometheus Template plugin scrapes a Prometheus metrics endpoint (typically /metrics) and collects all exposed timeseries data. You can configure a custom plugin using this template in minutes.
- Navigate to Settings > Custom Monitoring Plugins:
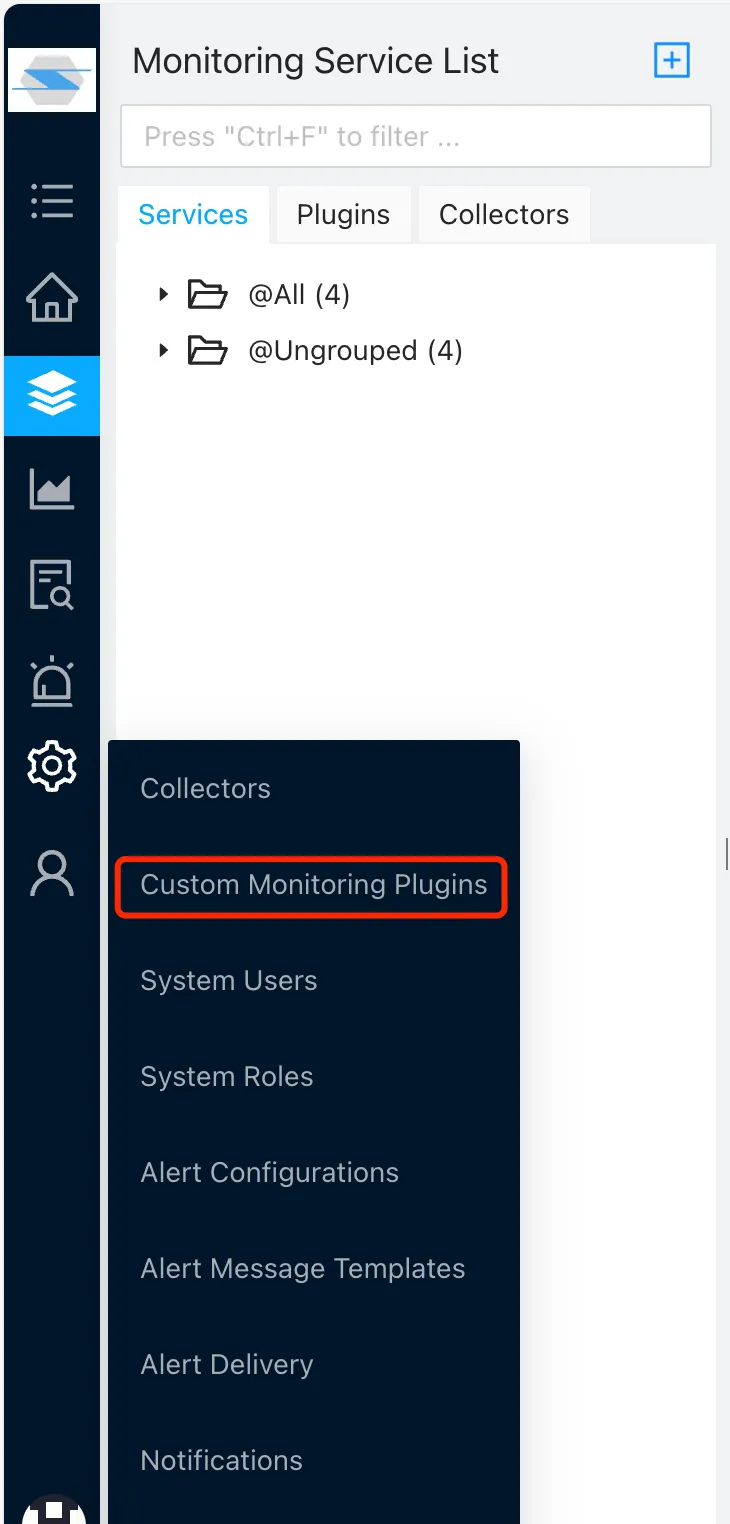
This page displays all custom plugins and allows you to create new ones:
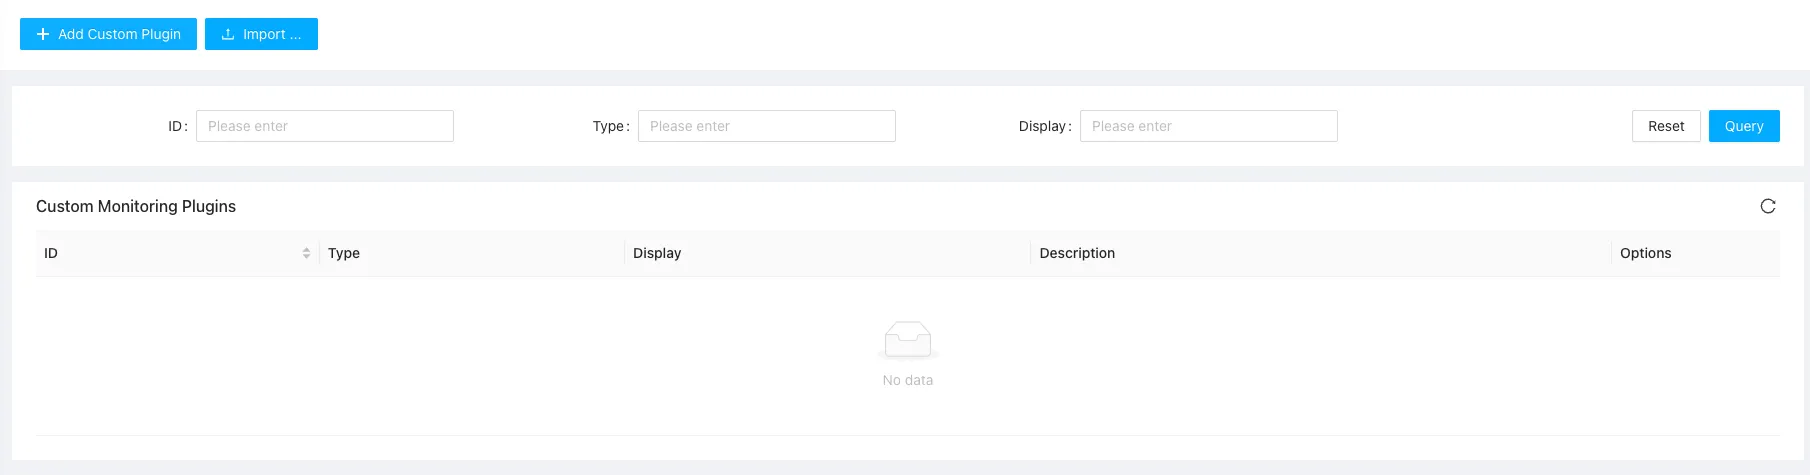
- Click the Add MP Template button in the top-left corner. In the dialog, enter a descriptive plugin name and set the Template Type to Prometheus Exporter:
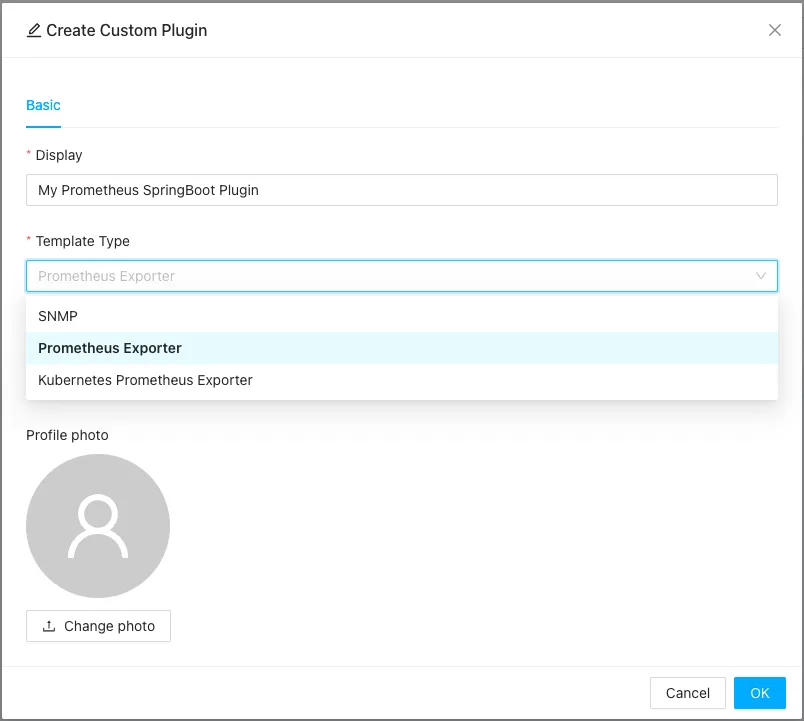
Note: If your exporter runs inside a Kubernetes cluster, select Kubernetes Prometheus Exporter instead of Prometheus Exporter to enable dynamic pod/service discovery. See details below.
- You can optionally upload a custom icon for the plugin. Click OK to complete the creation step.
Once created, the custom plugin will appear in the plugin library, ready to be used in monitoring services.
Create Monitoring Services with the Custom Plugin
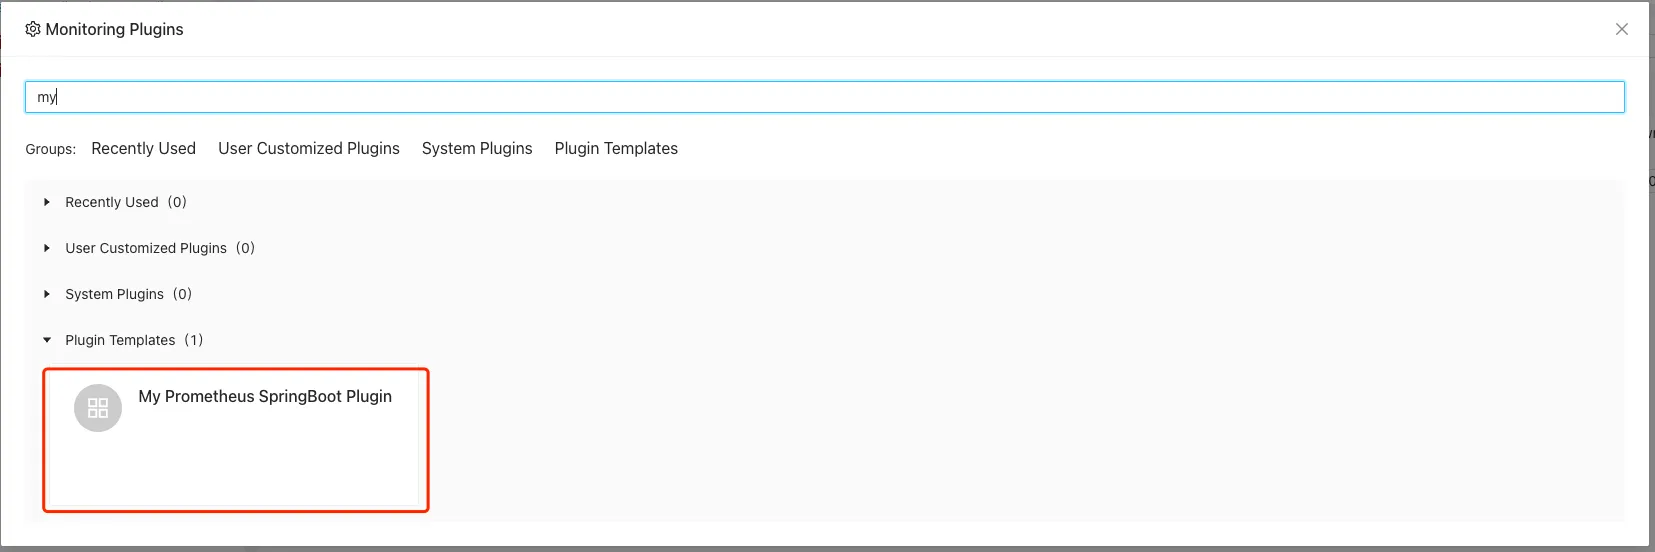
To deploy your new custom plugin, create a new service as described in Add Monitor Service and select your custom plugin from the list:
In the parameters step, specify the connection endpoint for the exporter:
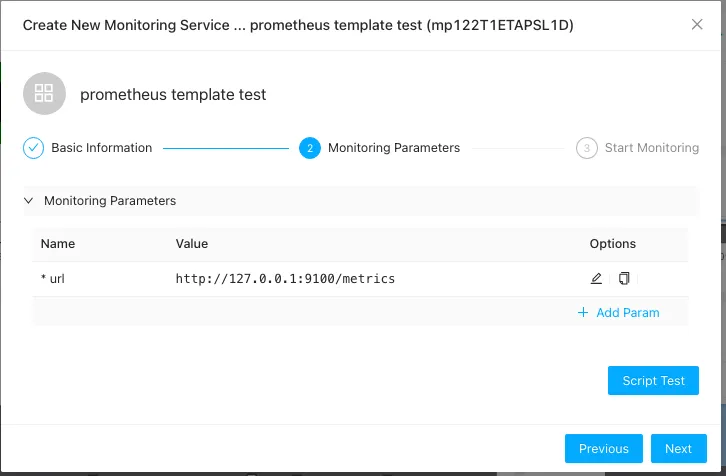
For standard environments, enter the scrape URL. If you are using the Kubernetes Prometheus Exporter, the configuration dialog will prompt you for Kubernetes-specific discovery parameters:
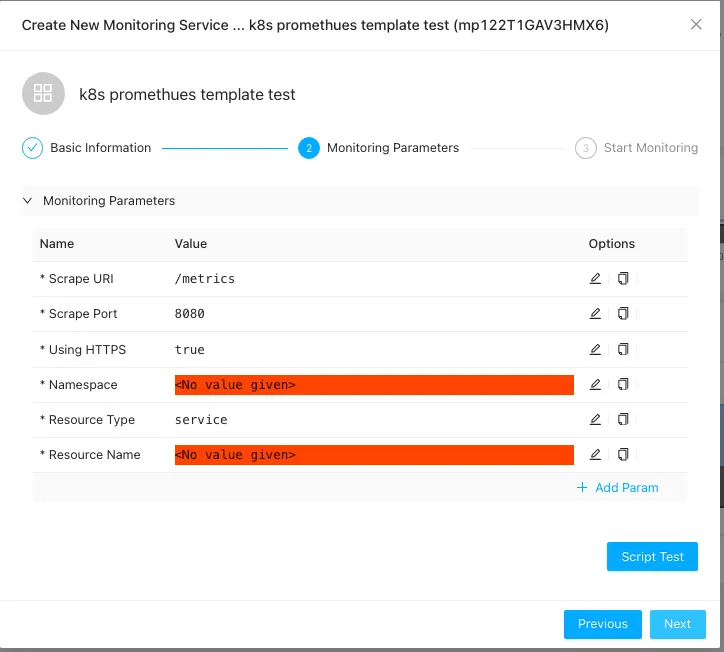
Fill in the discovery parameters depending on how your exporter is exposed:
- Scrape URI: The path of the metrics endpoint (e.g.,
/metricsor/actuator/prometheus). Do not include the host or port. - Scrape Port: The container or service port number to scrape.
- Using HTTPS: Enable this option if the endpoint requires TLS/HTTPS.
- Namespace: The Kubernetes namespace where the exporter is deployed.
- Resource Type: Set to
serviceif the exporter is exposed via a Kubernetes Service, orpodto target pods directly. - Resource Name: The exact name of the Kubernetes service, or a RE2 regular expression to match target pod names.
Click Finish to save. ZoomPhant will begin scraping the exporter.
Viewing Data
By default, new custom plugins do not contain pre-configured dashboards. You can build custom panels or import a matching Grafana dashboard as described in Importing Grafana Dashboards.