Linux Monitoring
Linux Monitoring
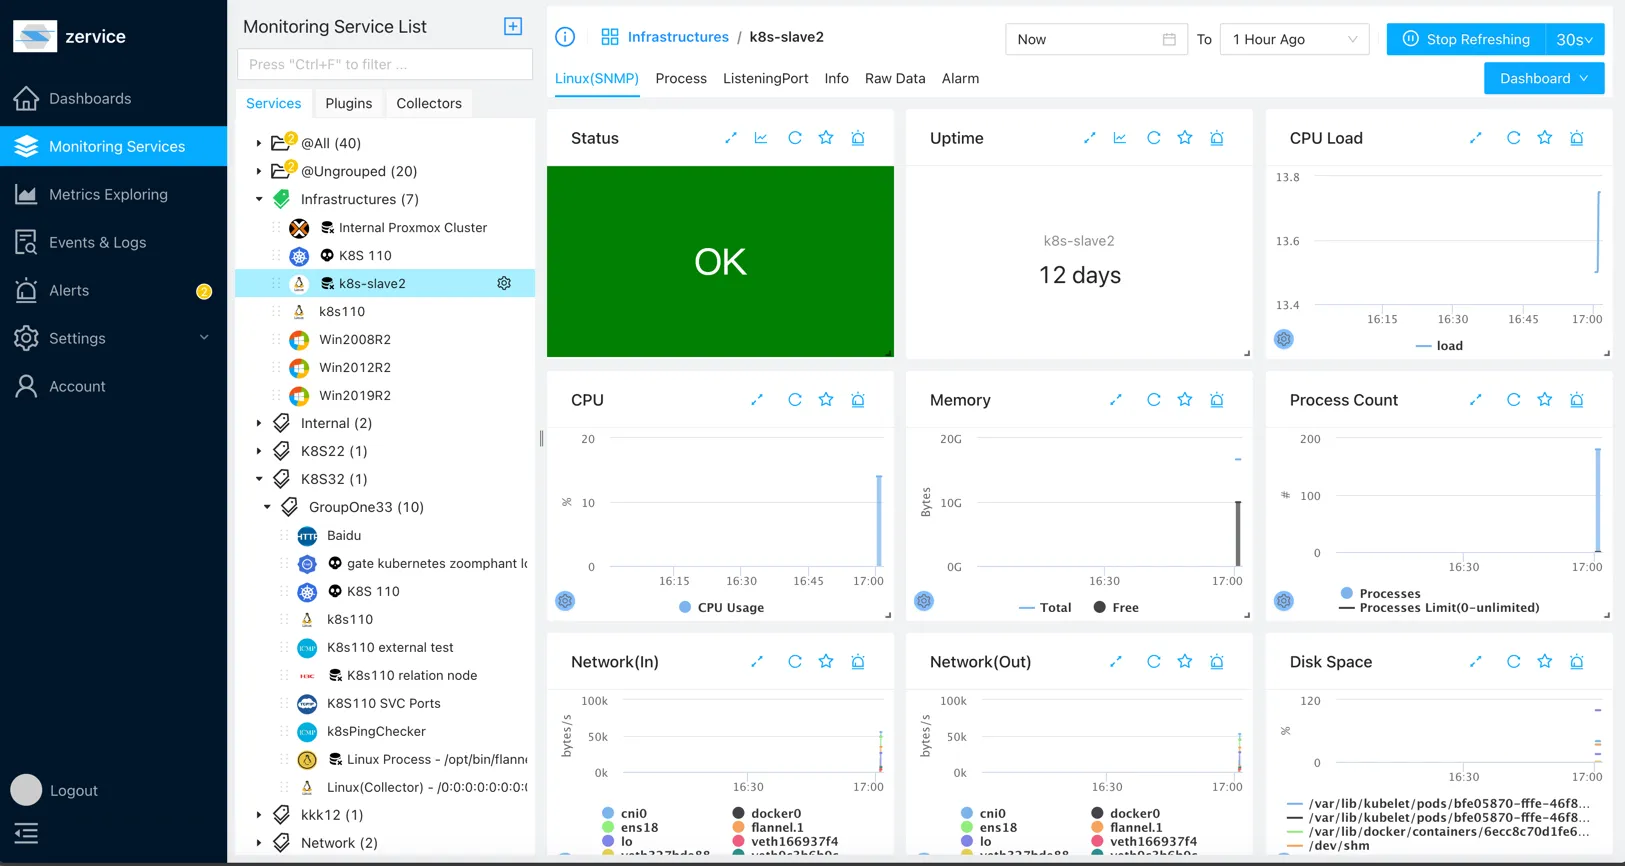
Linux monitoring entails a suite of tools designed to monitor the health and performance of Linux servers. ZoomPhant offers two modes for monitoring Linux servers:
- In-depth monitoring: By installing the ZoomPhant collector agent on the target Linux host.
- Agentless monitoring: By querying the host via the SNMP protocol.
In-Depth Monitoring (Agent-Based)
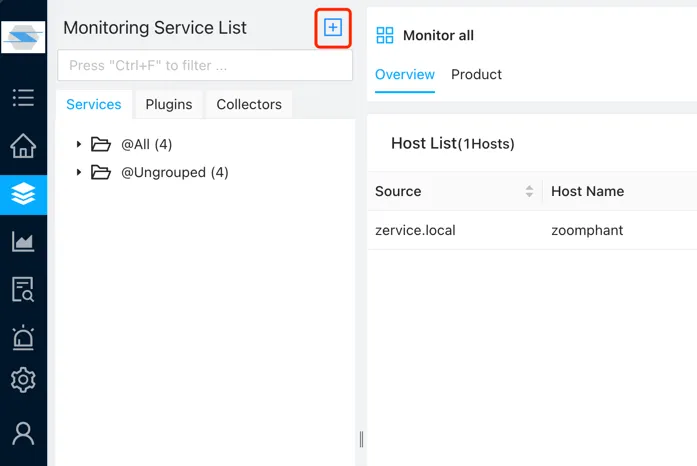
Navigate to the Services page in the sidebar and click the Add button in the top-right corner of the Services panel:
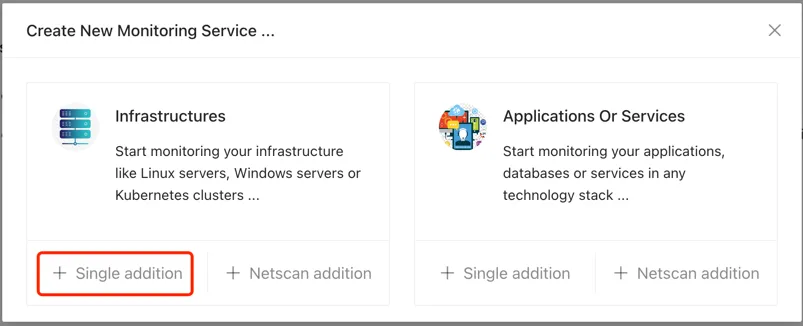
In the popup window, select Single addition under Infrastructures:
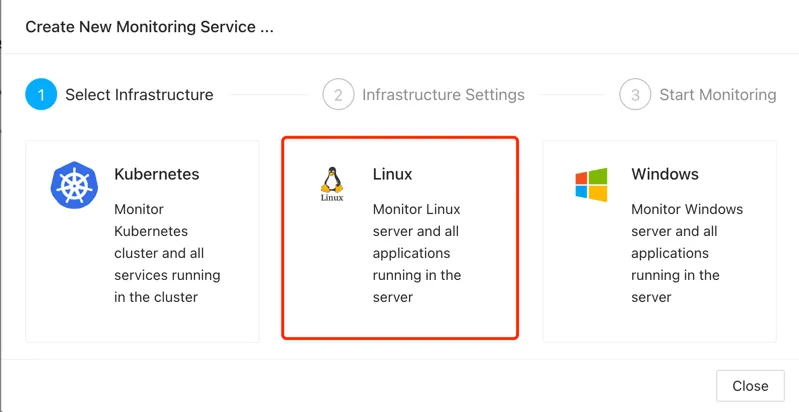
Next, choose Linux:
Configure the basic service settings:
- Service Name: We recommend using clear, descriptive names to make troubleshooting easier when alarms occur.
- In-depth Monitoring: Enabled by default. This collects comprehensive host metrics (including CPU, memory, disk I/O, process lists, network throughput, and security logs). ZoomPhant collects this data at a 1-minute granularity, which is highly recommended in cloud environments like AWS to reduce CloudWatch costs.
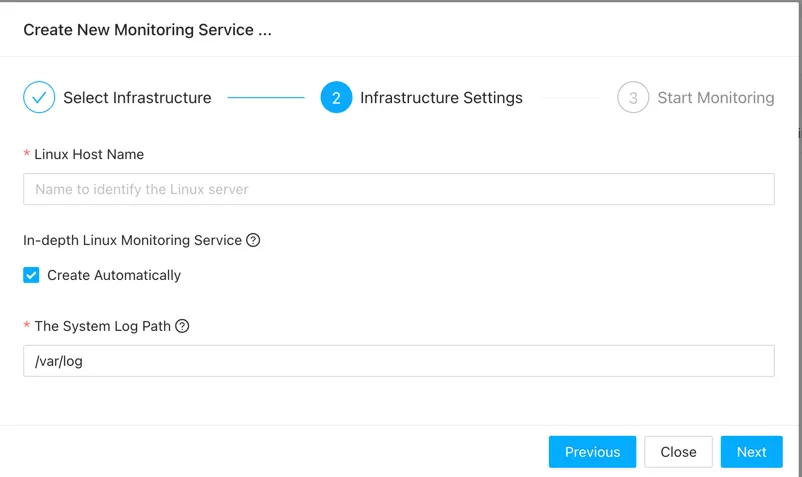
Click Next to proceed. Copy the generated installation command and execute it on the target Linux server. Note that running the installer requires root privileges.
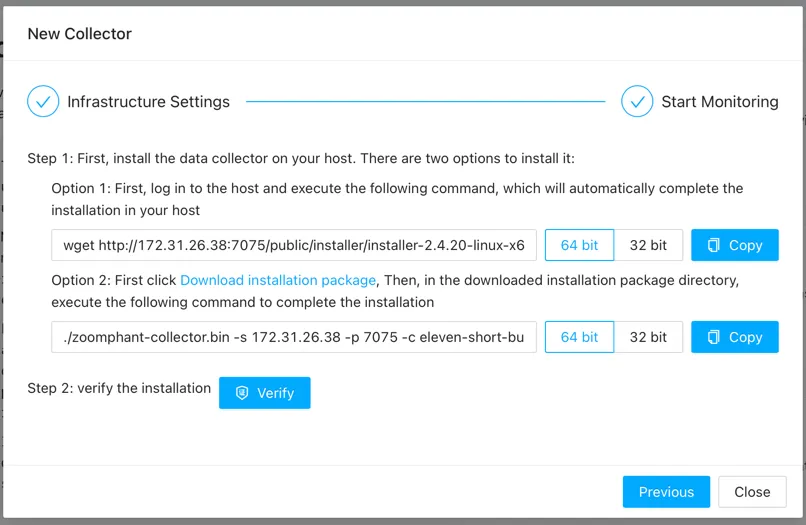
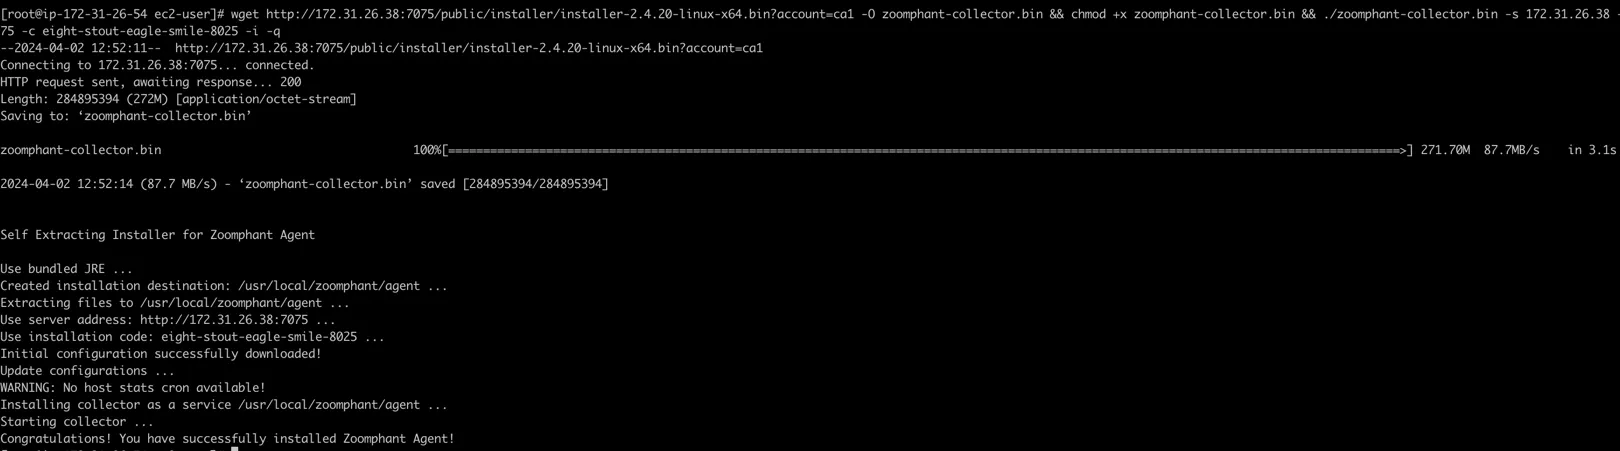
Once the script runs successfully, you will see a success confirmation in the terminal. If the host fails to download the package, verify that the External Host parameter in the global configuration is set correctly and the Collector Server is accessible. For other installation failures, please contact support.
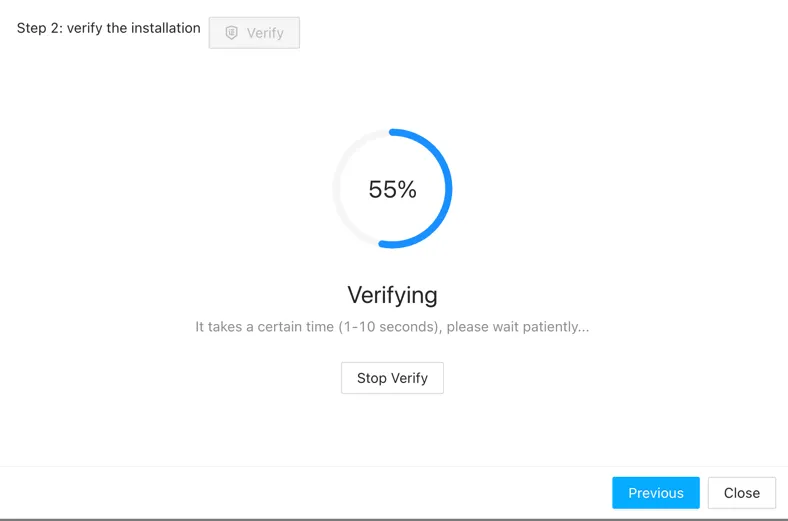
Once the agent is installed, click Verify in the wizard. A successful verification indicates that the collector has successfully connected and registered with the ZoomPhant server.
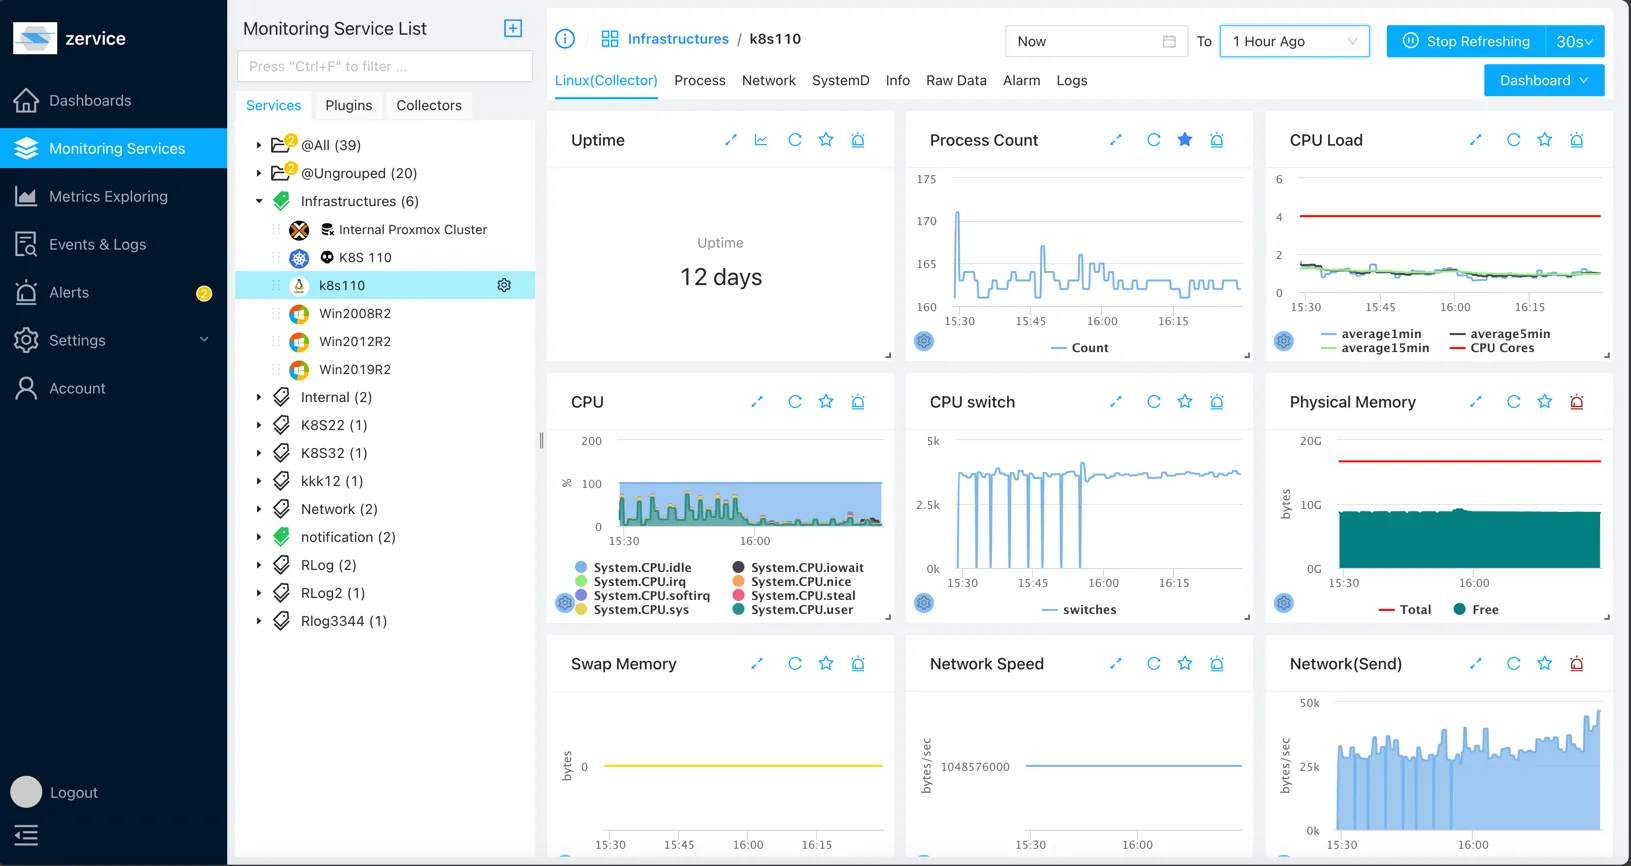
The newly added server and its collector will now appear on the Services page.
Agentless Monitoring (SNMP)
Before configuring SNMP monitoring, ensure that the SNMP daemon is running on the target server. Here is an example of installing and configuring SNMP on CentOS:
# Install SNMP service
yum install -y net-snmp net-snmp-utils
# Configure SNMP service
vi /etc/snmp/snmpd.conf
# Modify `/etc/snmp/snmpd.conf` to include the `.1.3.6.1` view for comprehensive system metrics:
view    systemview    included   .1.3.6.1
# Restart SNMP service
systemctl restart snmpd.service
# Add SNMP service to startup
systemctl enable snmpd.service
Adding SNMP Monitoring
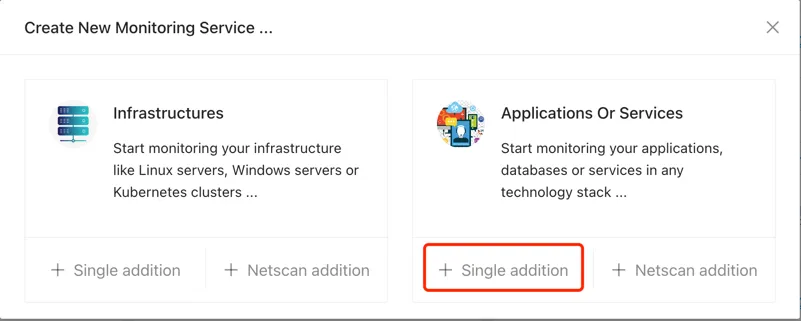
Navigate to the Services page and click the Add button. In the popup window, select Single addition under Application or Services:
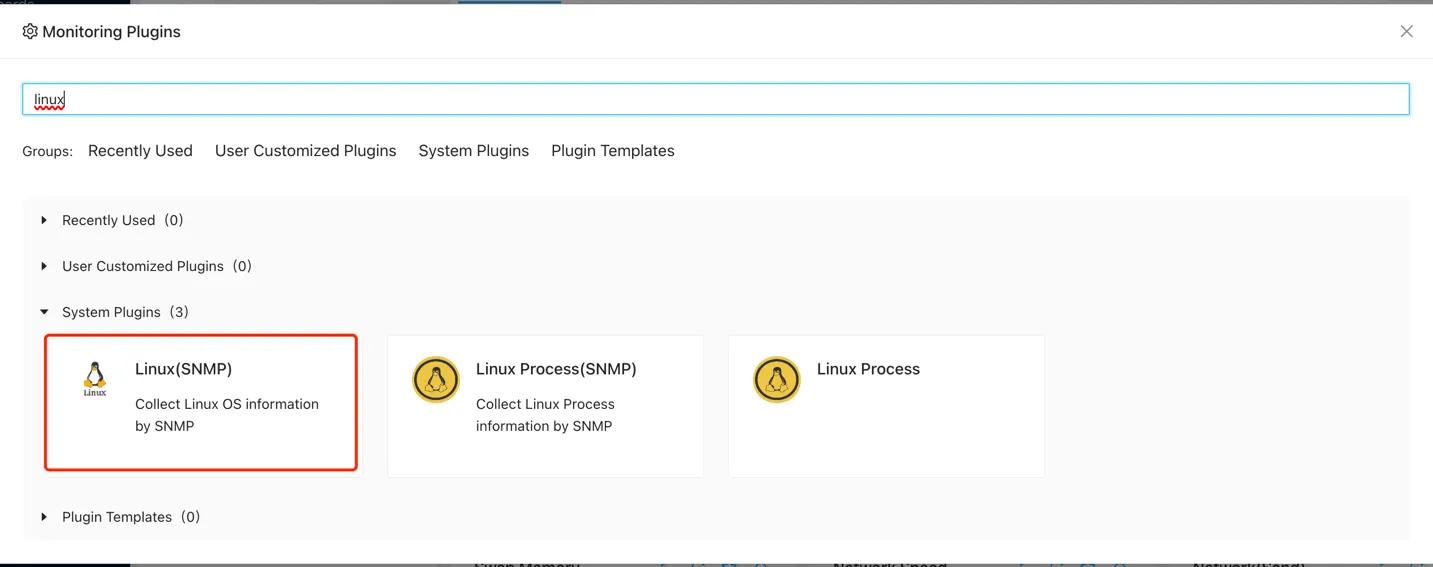
Choose Linux (SNMP) from the plugin selector (you can also search for “Linux”):
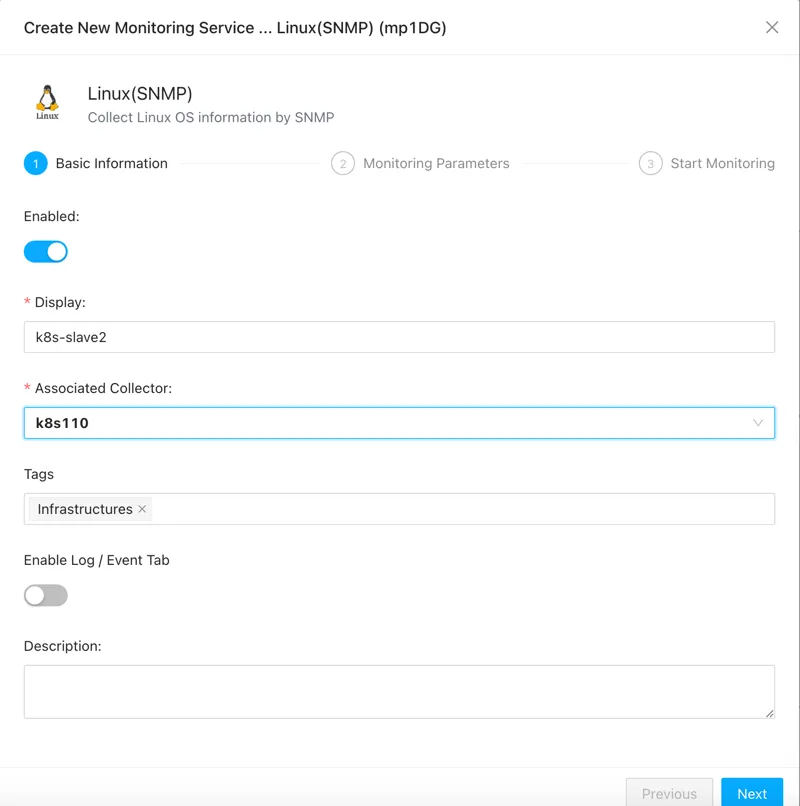
Configure the basic service settings:
- Service Name: Enter a name for the service.
- Associated Collector: You must select an active Collector that has network access to the target host. Because SNMP communicates over UDP, it is recommended that the collector and the target server reside on the same Local Area Network (LAN).
Enter the IP address of the target server, select the SNMP protocol version, and configure the authentication settings (such as the community string):
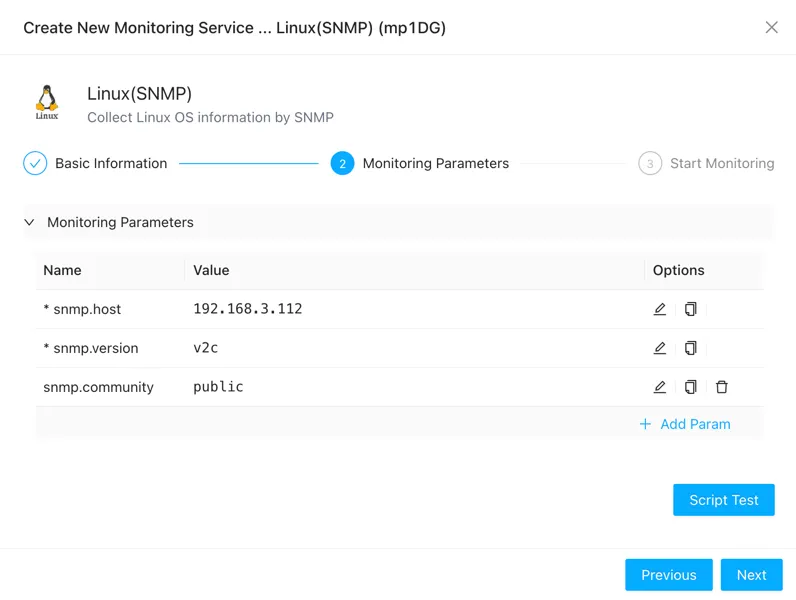
Click the Test button to verify that the collector can successfully query the SNMP service on the target host.
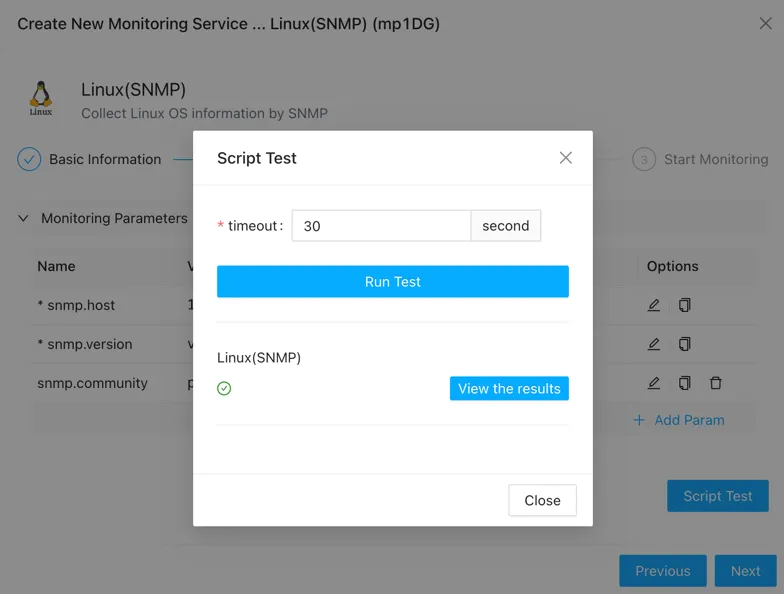
Once confirmed, click Next to complete the configuration and save the service.
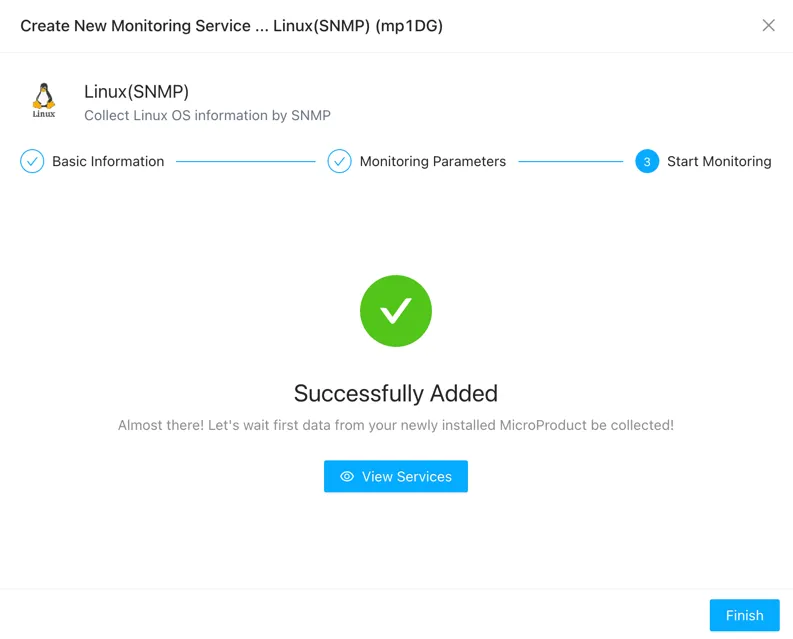
The new SNMP-monitored service will now be visible on the Services page.