Port Monitoring
Port Monitoring
A common task in infrastructure monitoring is verifying the availability of network services (e.g., SSH, database ports, or web servers). One of the most effective ways to do this is by checking if the corresponding TCP ports are open and accepting connections. ZoomPhant provides the Port Checker plugin for this purpose.
Create Port Monitoring
To configure port monitoring, select the Port Checker plugin from the plugin library as described in Add Monitor Service. You will be prompted to configure the following parameters:
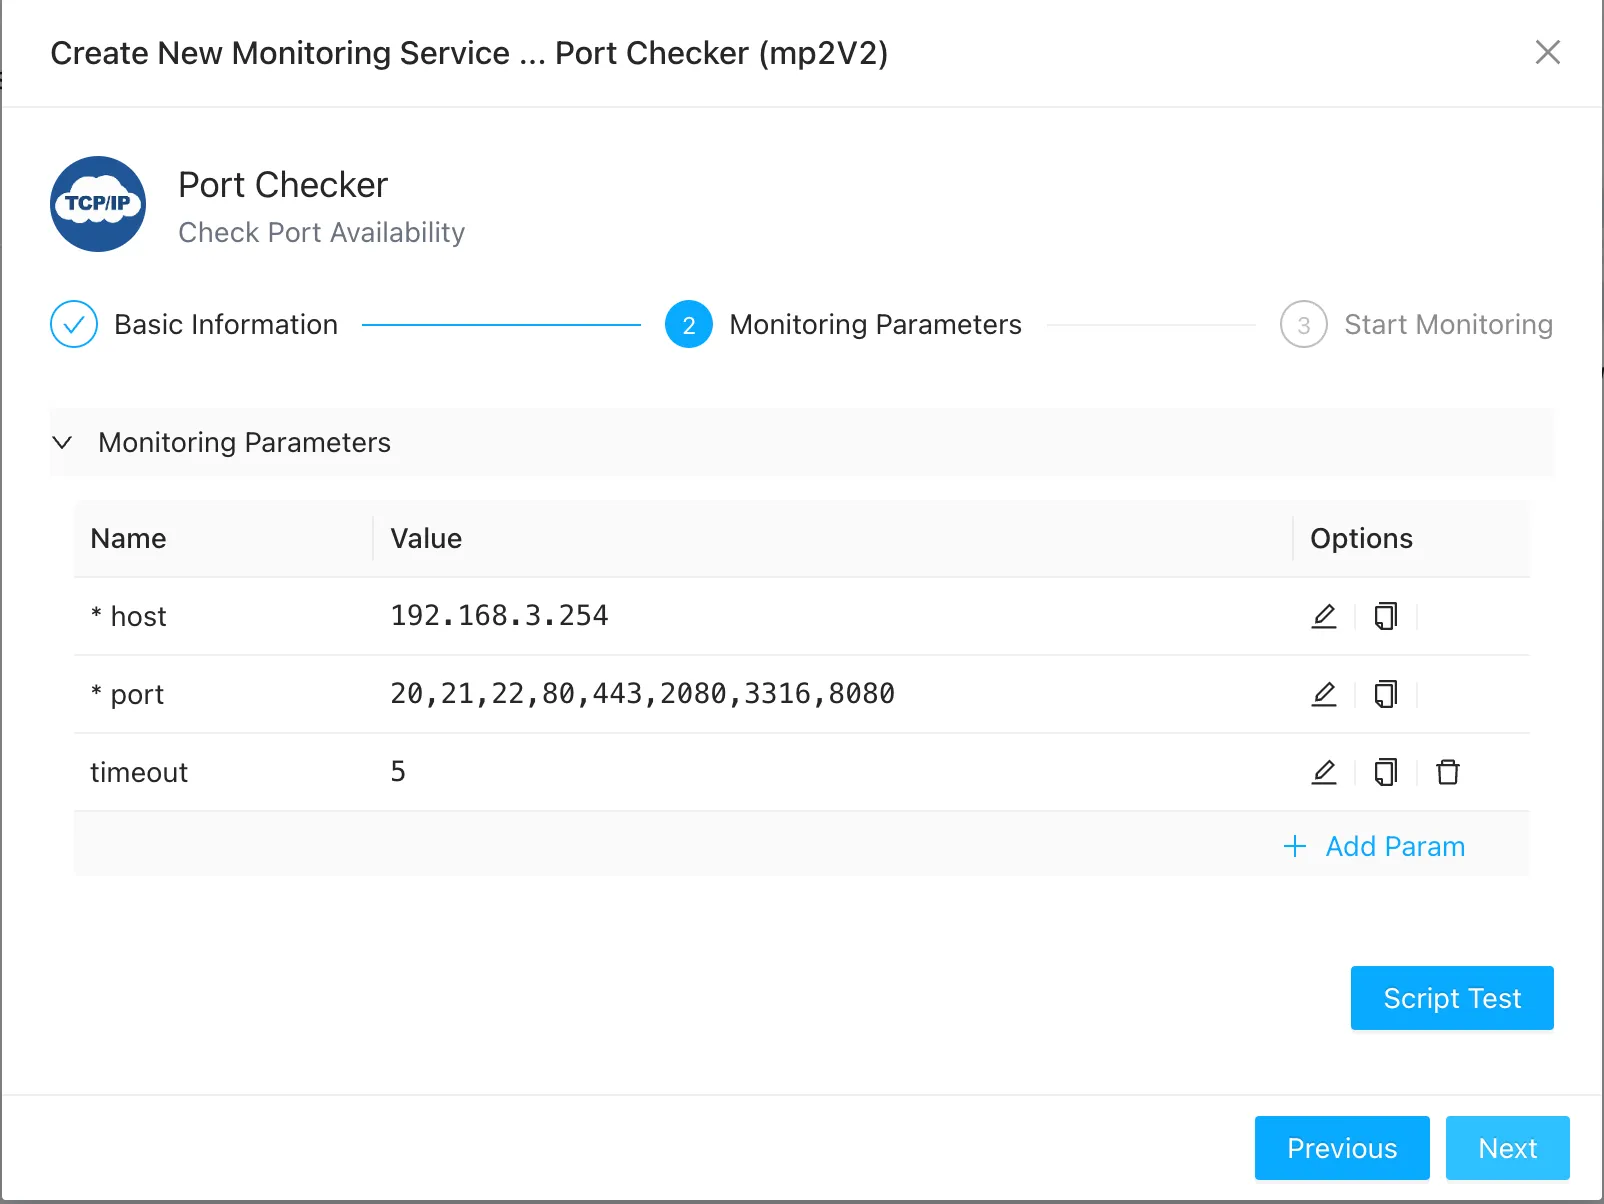
- host: The IP address or domain name of the target server to check (required).
- port: A comma-separated list of TCP ports to monitor (e.g.,
80,443,3306). - timeout: The connection timeout in seconds. Defaults to
5seconds.
Once you have configured the parameters, click Test to verify connectivity, and then click Finish to add the service.
Understanding Port Checker Metrics
After adding the service, select it from the service list to view the port health dashboard:
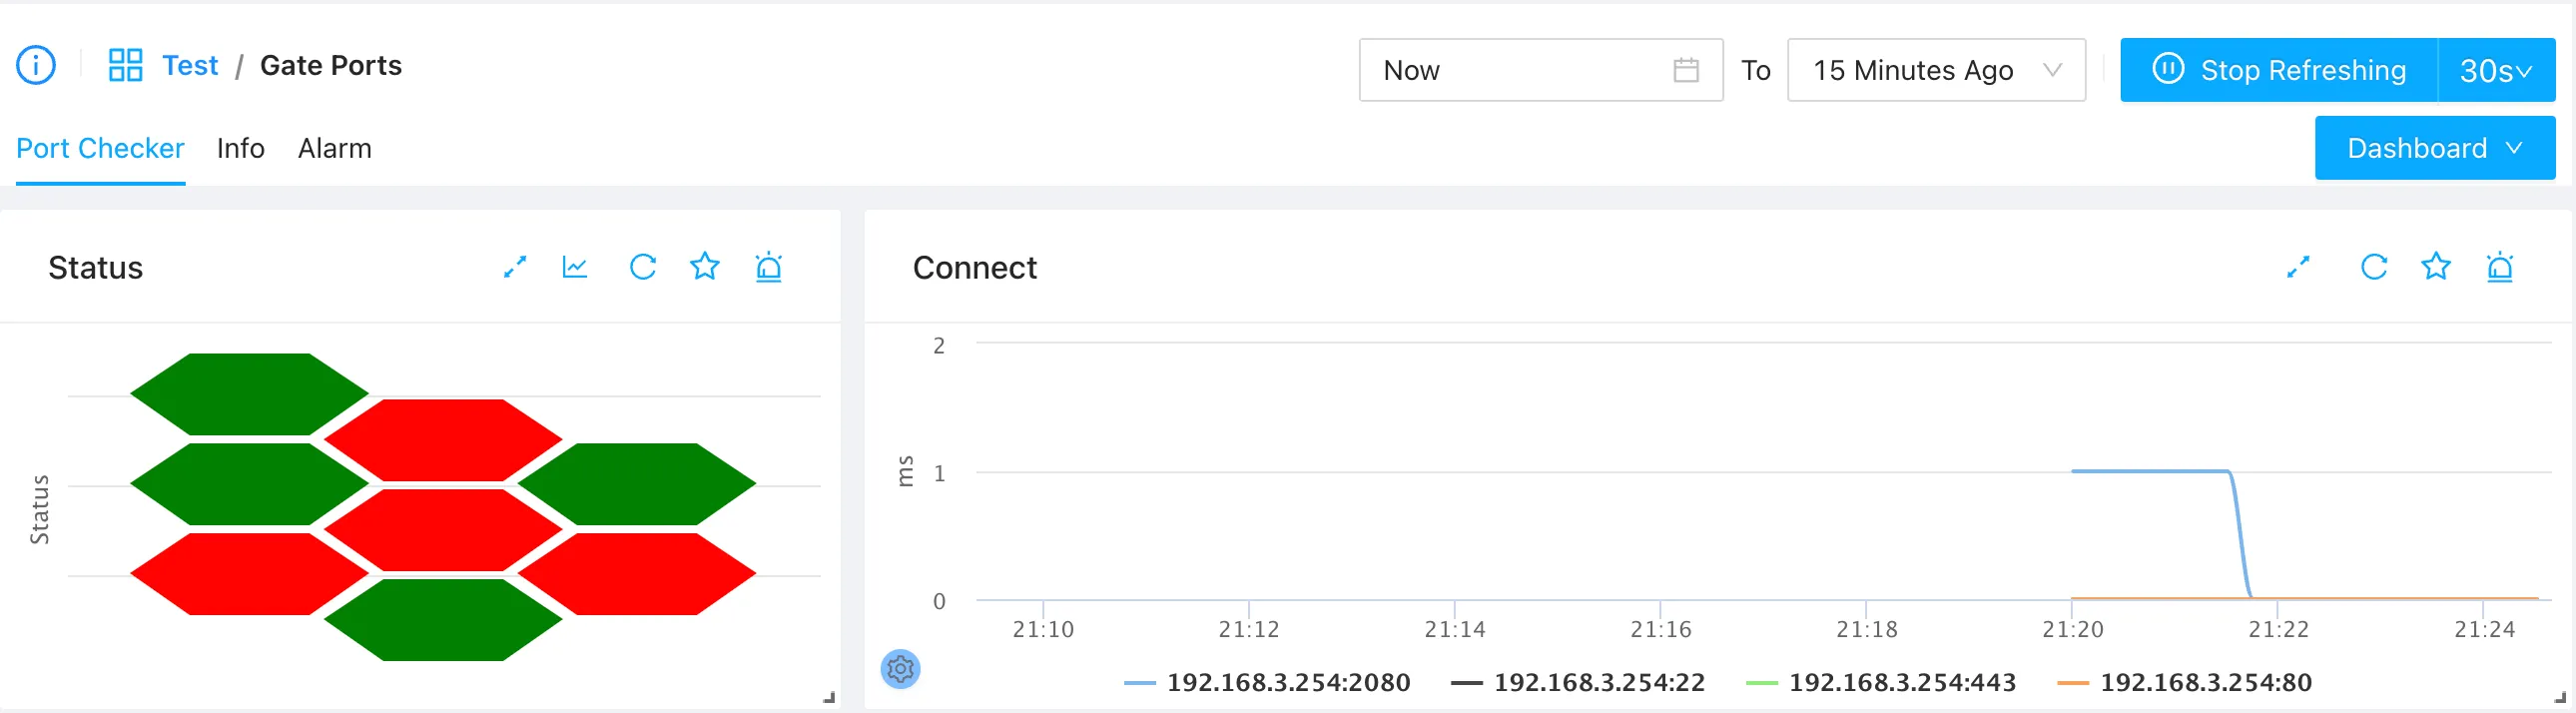
The dashboard presents port data through two main widgets:
- Status: The Status widget displays a visual list of target ports. Hovering over a port shows its detailed status (e.g.,
ip:port status). Green items indicate an open port (status0), while red items indicate a closed or unreachable port (status1). - Connect Time: The Connect widget tracks the time taken (in milliseconds) to establish a connection to each active port over time. Latency spikes on this chart can indicate high server load, network congestion, or service degradation.