Monitoring Service
Monitoring Service
Monitoring Service
In ZoomPhant, a monitoring task is referred to as a Monitoring Service. You create a Monitoring Service from a plugin that you have created or one provided by ZoomPhant or a third party.
Adding a Monitoring Service
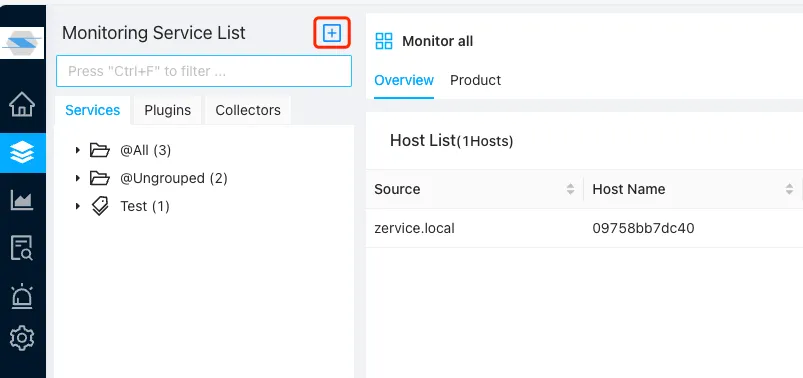
To add a monitoring service, click the Add button in the top-right corner of the Services panel to open the creation wizard:
The first step is to choose the type of monitoring service:
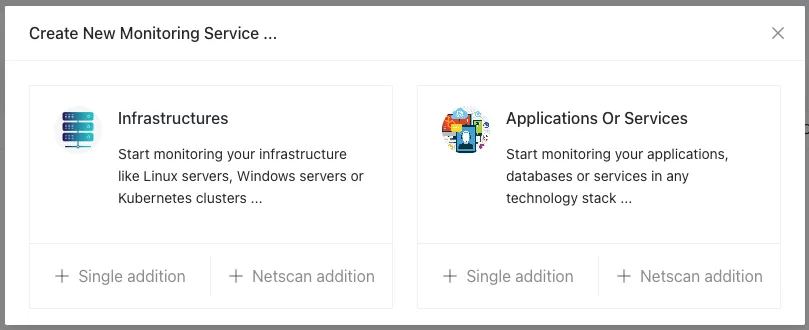
- Infrastructure Monitoring Service: A system-level service that requires installing a data collection agent on the target server. The agent collects system-level metrics and routes data from other services that run on that server.
- Application Or Service: The most common type of service. Used to monitor specific remote objects like databases, web servers, domain names, or websites.
Once you decide on the type of monitoring service, you can choose to add either a single service or a batch of similar services (e.g., a group of servers or database instances). Batch operations are covered in detail later, but for now, we will add a single monitoring service by clicking Single addition under Application or Services.
Choosing a Monitoring Plugin
After selecting “Single Addition”, you will be prompted to choose a Monitoring Plugin from the selector. You can use standard system plugins, community plugins, or your own custom designs:
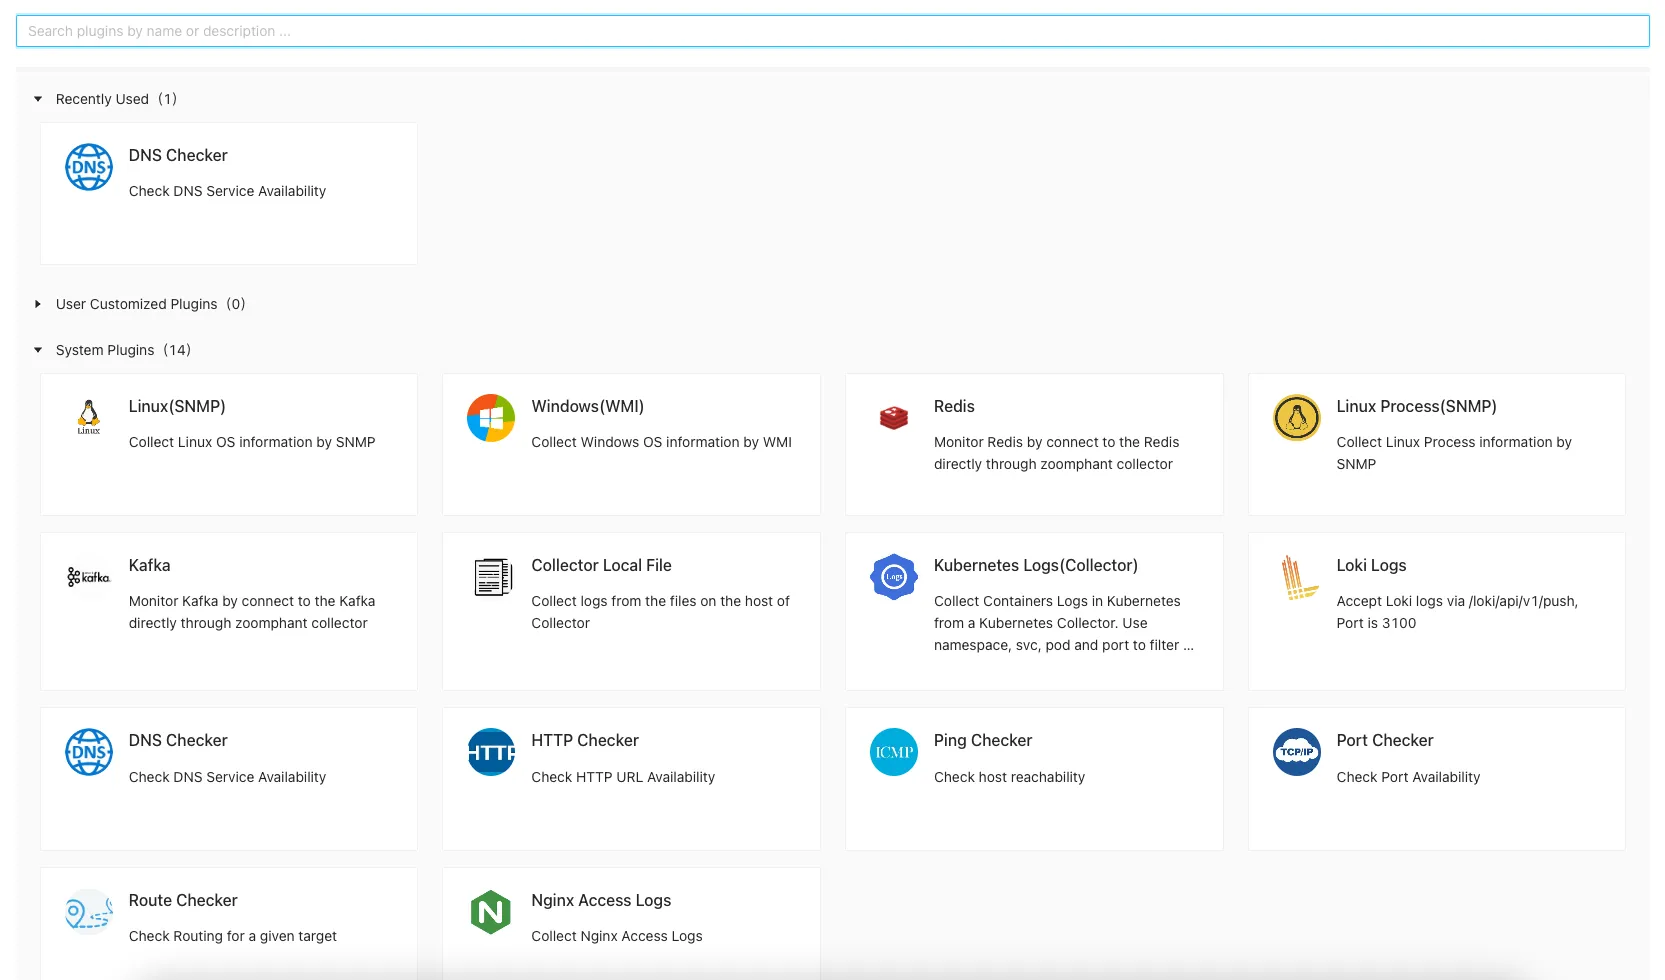
Use the search bar at the top of the selector to filter plugins by keyword, or navigate using these categories:
- Recently Used: Highlights plugins you have configured recently, saving you from searching the entire list.
- Custom Plugins: Lists custom plugins you have created or instantiated from a template.
- System Plugins: Default plugins created and maintained by ZoomPhant.
Once you select a plugin (for example, the DNS Checker), a setup wizard will guide you through the rest of the configuration.
Providing Basic Service Information
The first page of the wizard requires the following basic information:
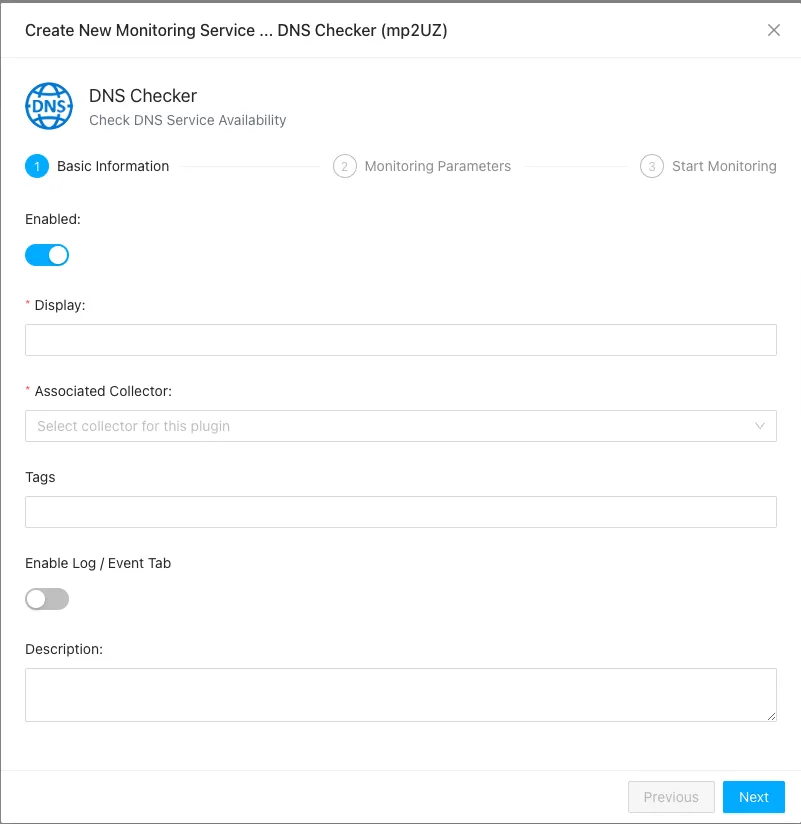
- Display: A user-friendly name for the Monitoring Service.
- Associated Collector: The data collection agent that will run this check.
- Tags: One or more tags to group and organize your monitoring services.
- Description: A short, optional explanation of the service.
Click Next once you have filled in this information.
Configuring Parameters and Testing
Most plugins require configuration parameters to communicate with the target host. These parameters typically include details such as the host address, port, and credentials.
Parameters can be optional or mandatory. Mandatory parameters without default values must be filled in before you can proceed (such as the host parameter in the example below):
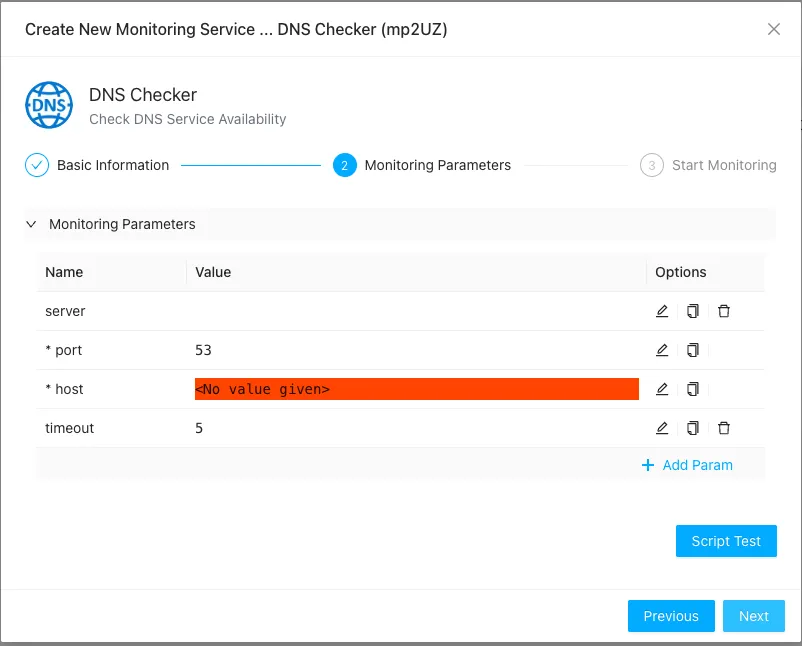
After entering the parameters, you can click the Script Test button to verify that data collection works as expected before saving.
In the test dialog, set a timeout value (default is 30 seconds) and click Run Test. Once the test completes, you can click View results to review the raw data collected and verify it matches your expectations.
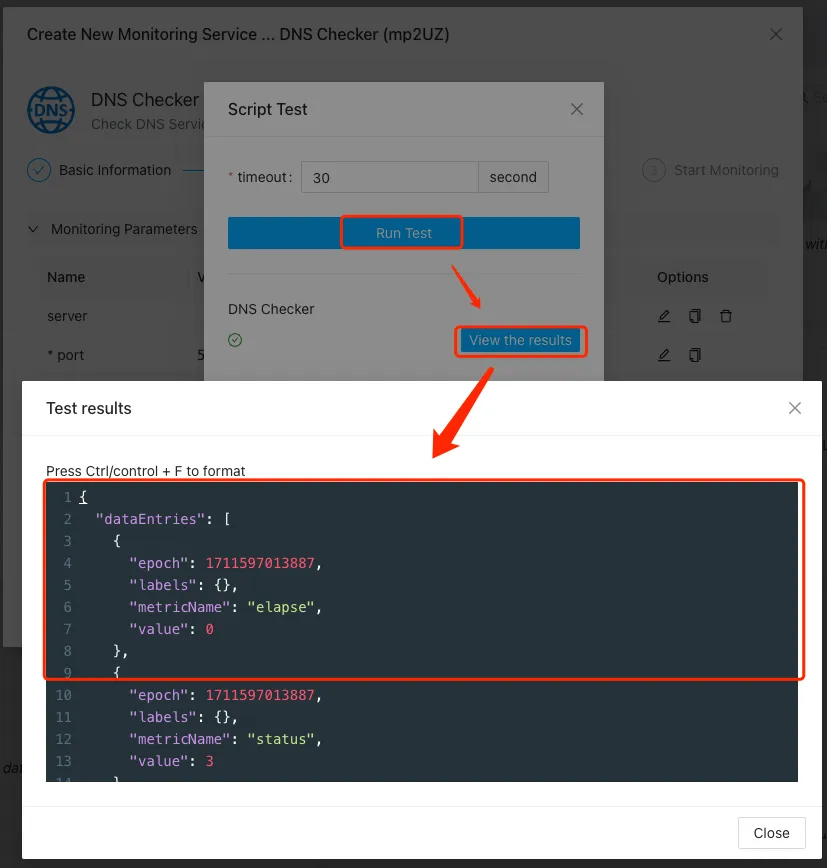
If the test fails, an error log is displayed instead to help you troubleshoot. Click Next to proceed to the final step.
Complete Service Setup
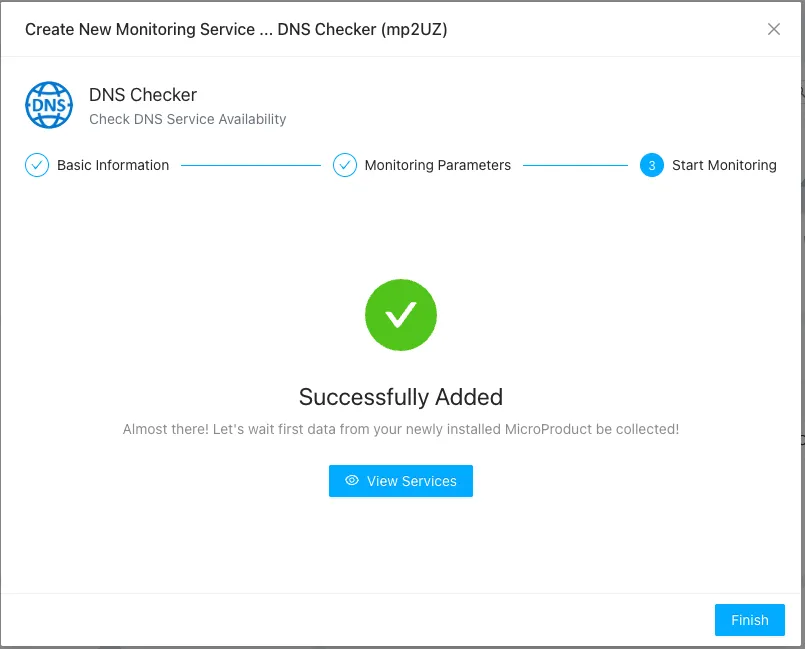
Your monitoring service is now active. Click Finish to close the wizard, or click View Services to navigate directly to the service’s dashboard.