Log Monitoring
ZoomPhant provides built-in log monitoring, allowing you to centralize logs and metrics within a single monitoring solution.
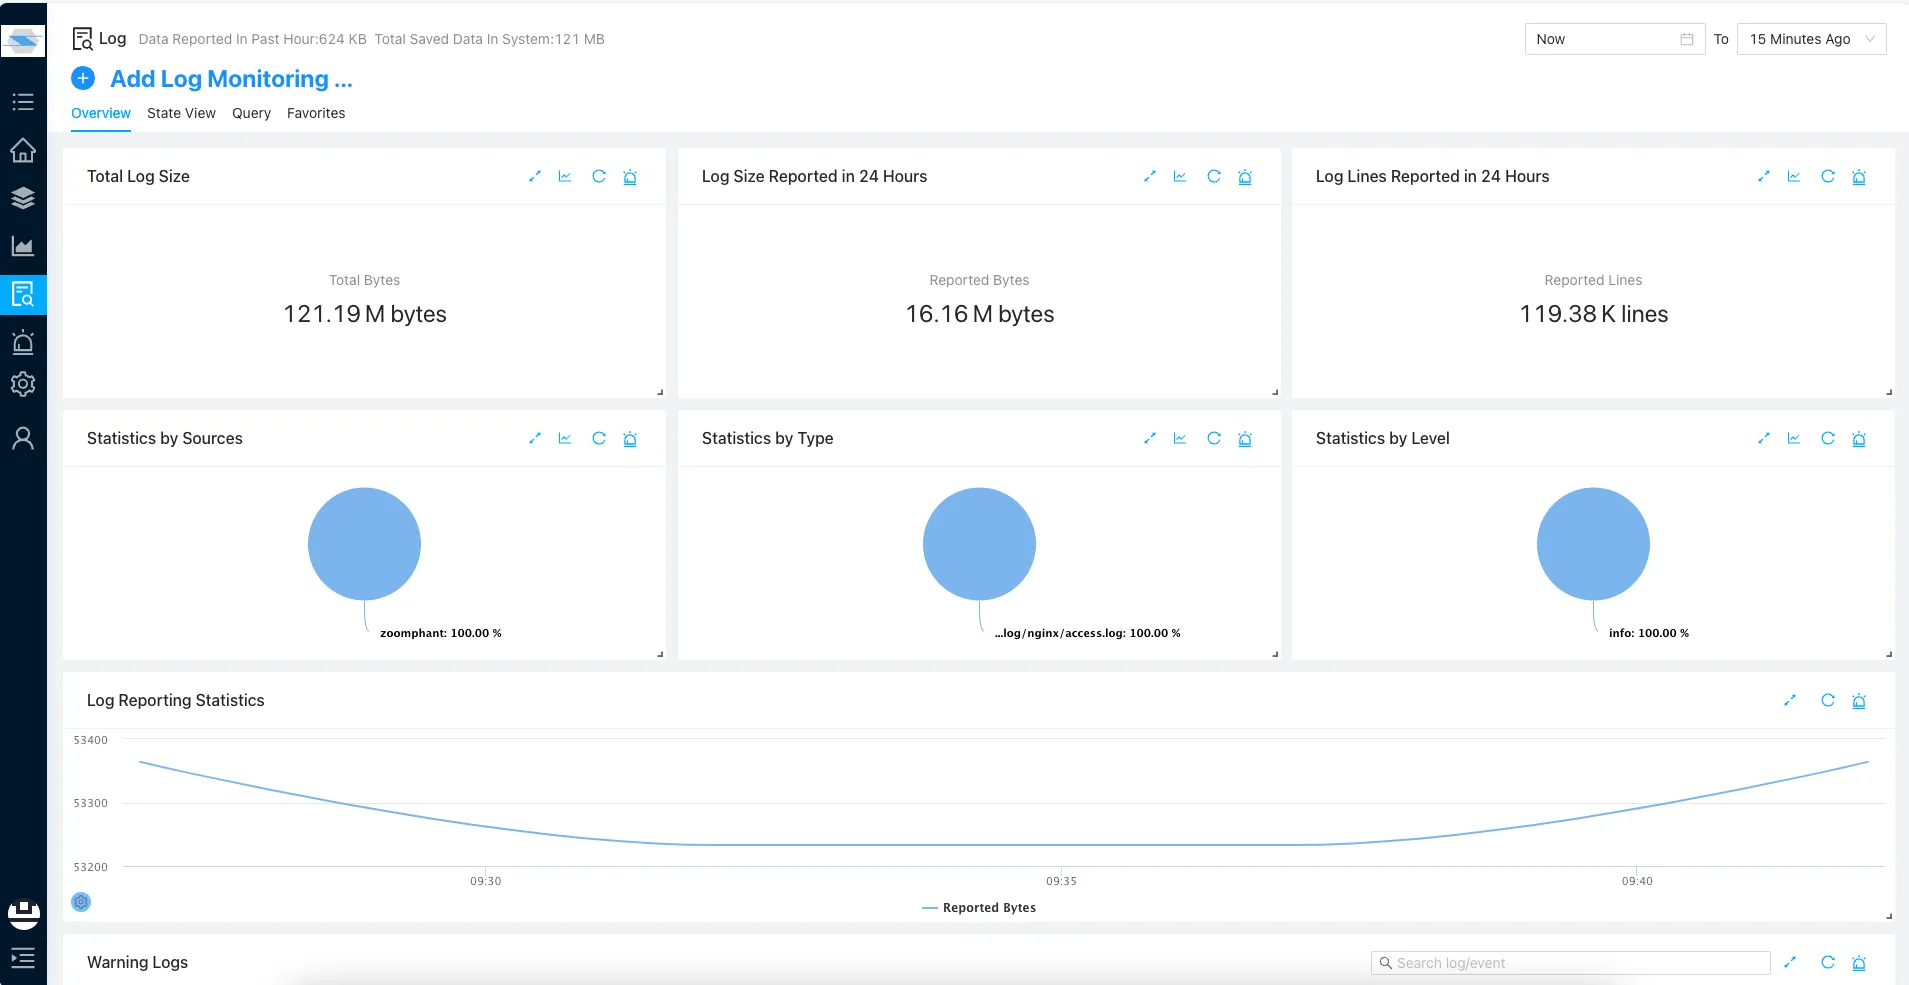
No additional configuration is required to start monitoring logs. Simply select a log monitoring plugin and begin collecting your logs. Within a few seconds, you can view log data on your service dashboard or via the centralized Log & Event browser:
Dashboard Tabs
Overview & State View
The Overview tab of the Log & Event page displays the overall status of your log ingestion, while the State View tab details each log monitoring service:
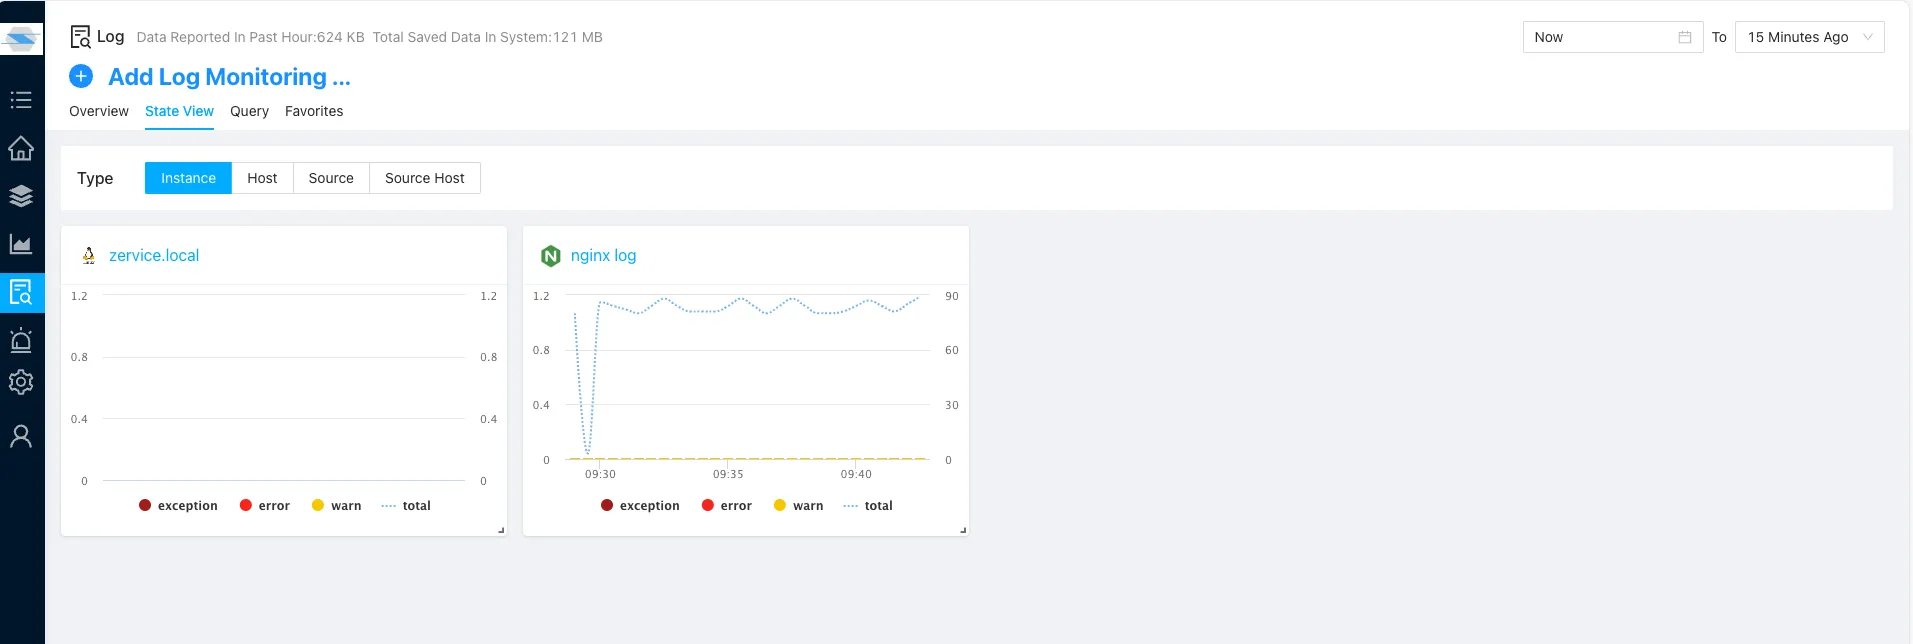
From this view, you can check the status of individual log sources. Click any source to see a detailed event state:
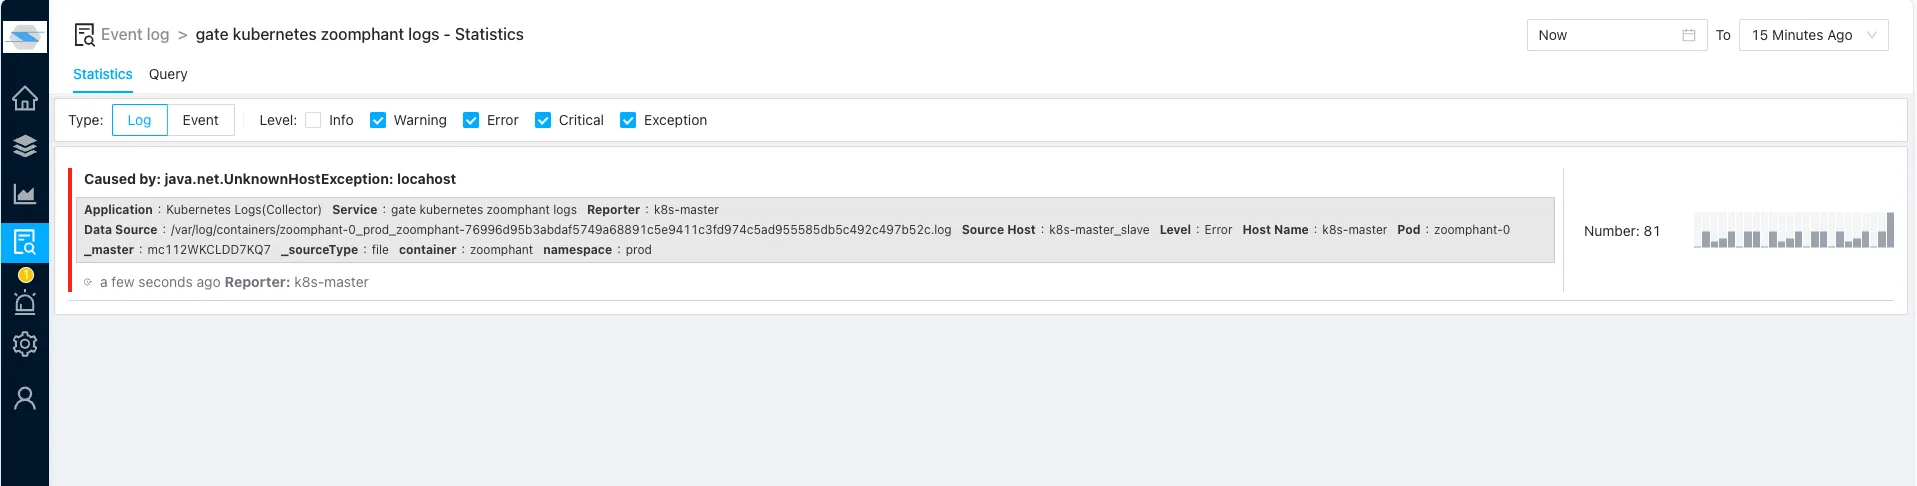
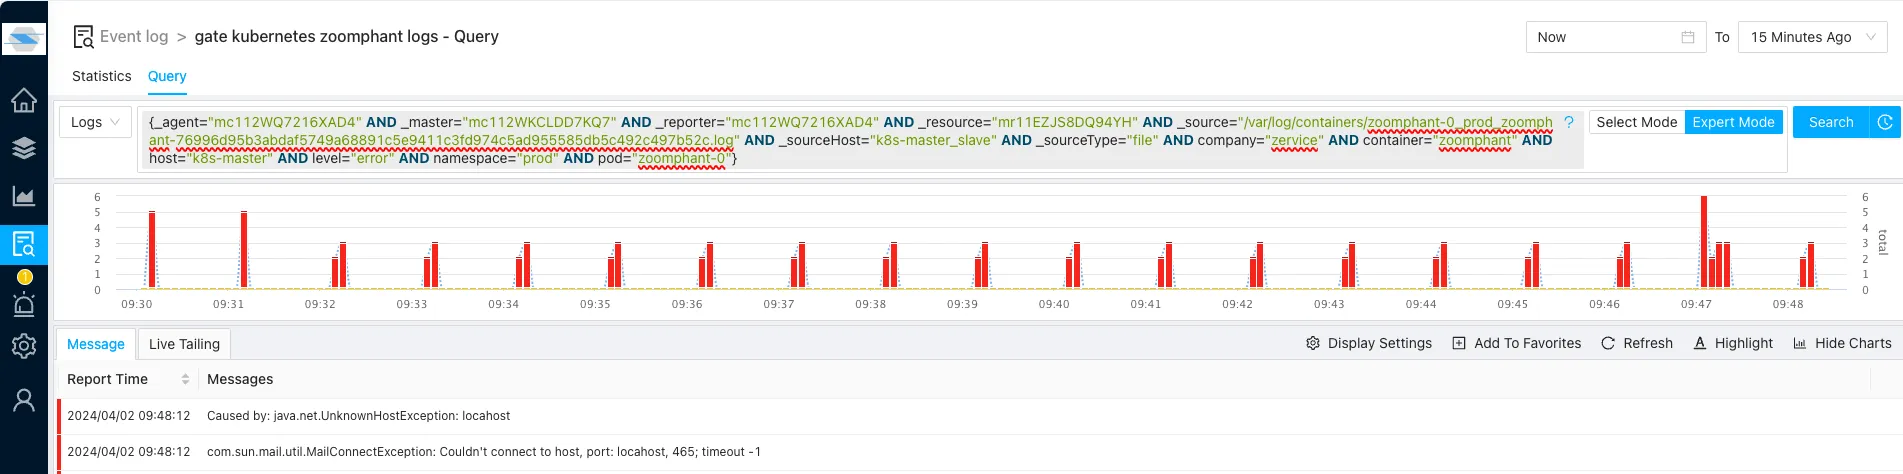
Click on any event or click the Query button to start querying and processing logs for that specific source:
General Query
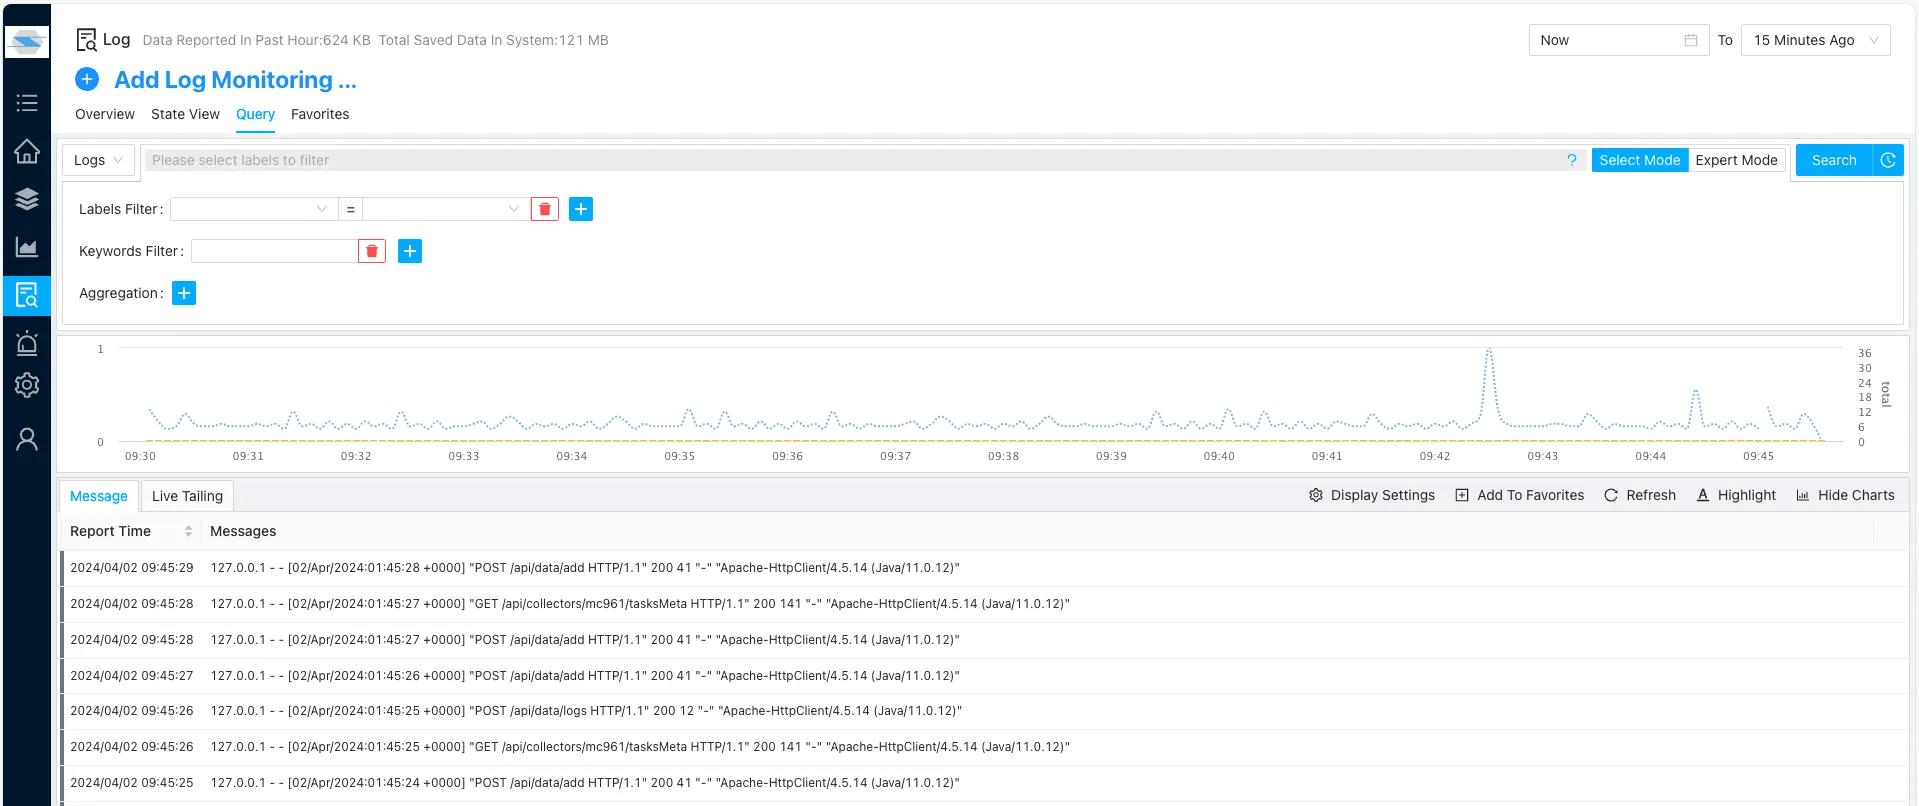
To query logs across all sources, click the Query tab on the main Log & Event page:
To search and filter ingestion logs, refer to the Log Processing Syntax documentation.