Alert Settings
Alert Settings
Alert Configuration
To utilize the alerting feature, you must first configure alert rules. ZoomPhant comes pre-configured with default alert rules covering common scenarios. Additionally, you can create custom alert rules tailored to your specific environment. We support two main methods for creating alert configurations: the General Method and the Quick Method.
General Method
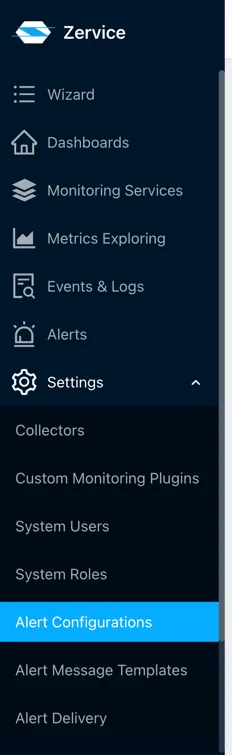
Navigate to the Alert Configurations page by clicking Settings > Alert Configurations in the sidebar.
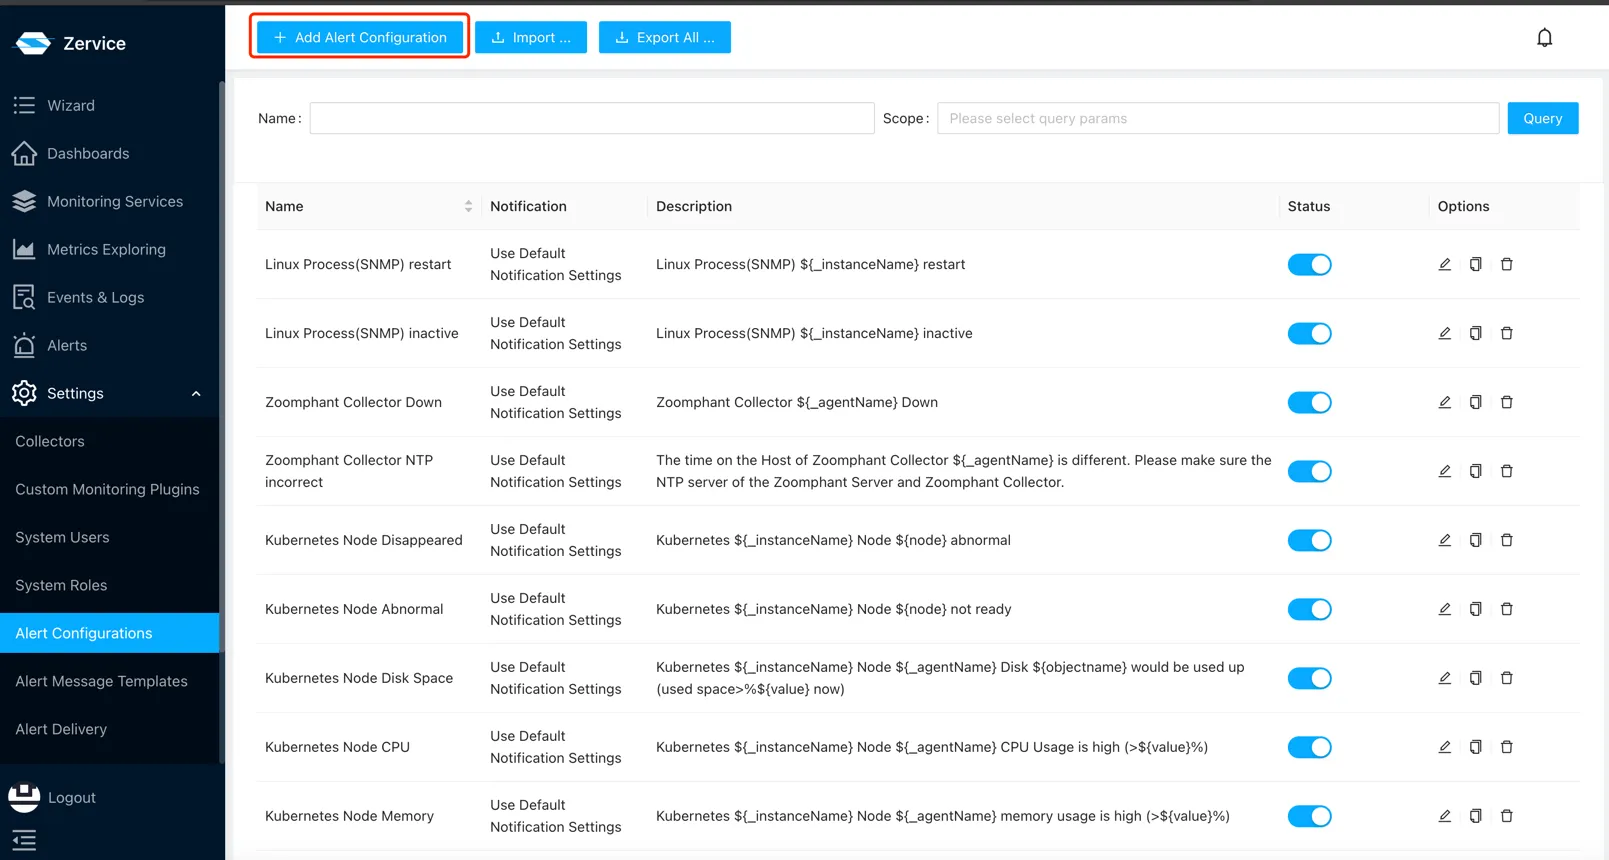
Next, click the Add Alert Configuration button in the top-left corner to open the creation wizard.
On the alert configuration page, define the following settings:
- Alert Name: Each alert name must be unique within the system. We recommend using clear, descriptive names to make troubleshooting easier when the alert triggers.
- Alert Metrics: Select the metrics that will trigger the alert. ZoomPhant supports three common scoping categories:
- Application: Applies to all devices of the same type (e.g., triggering an alert when CPU usage exceeds 80% on any Linux server).
- Service: Applies to specific instances of a service (e.g., triggering an alert when CPU usage exceeds 70% on a specific database server).
- Tag: Applies to a custom group of devices. You can group devices on the service page and target them together (e.g., triggering an alert when CPU usage exceeds 50% for all servers tagged as “db”).
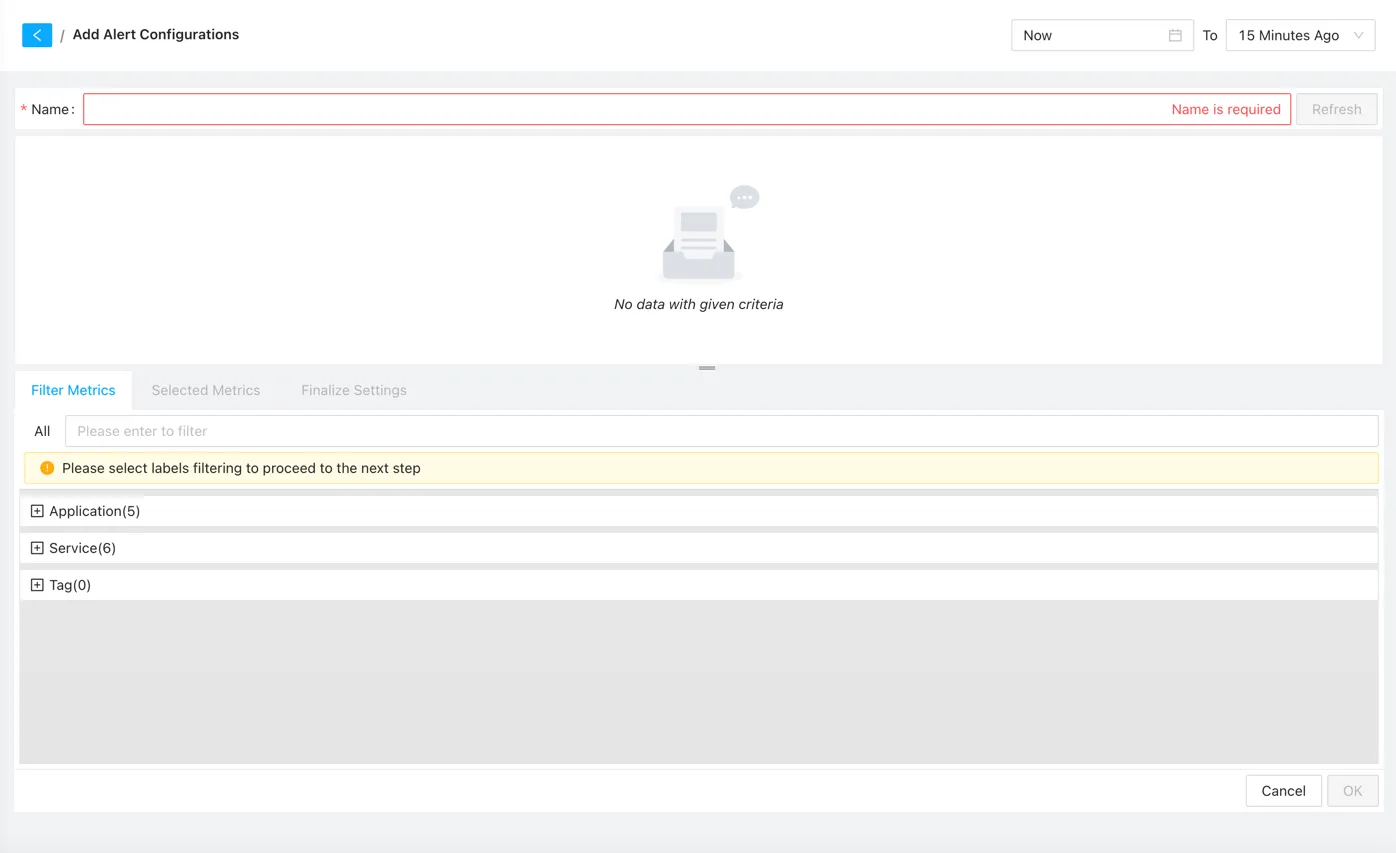
After selecting a category, the system will load the relevant metrics. Use the search box to find and select the specific metrics you want to monitor.
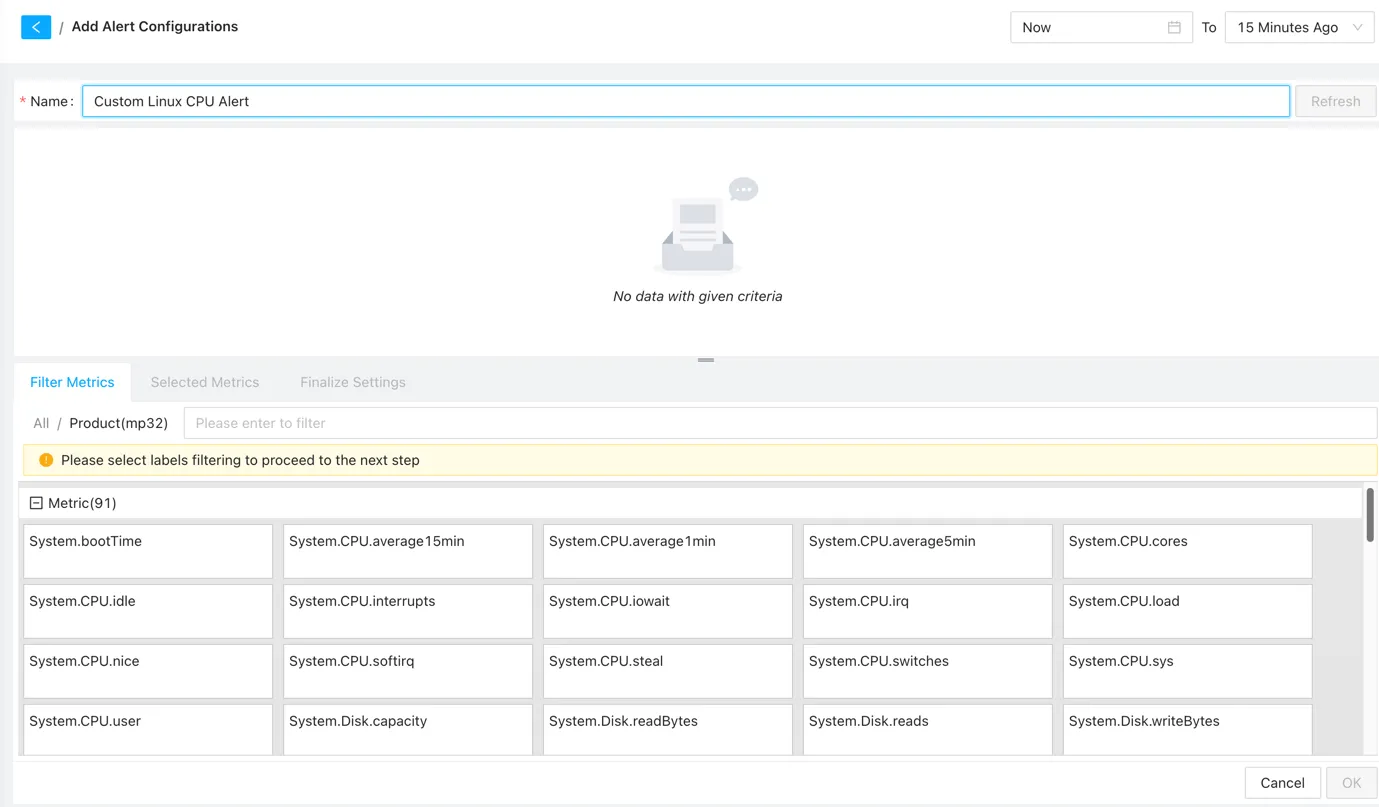
Once selected, the system lists the matching metrics, allowing you to review them and set threshold values. You can also add filtering conditions or modify the metric selection.
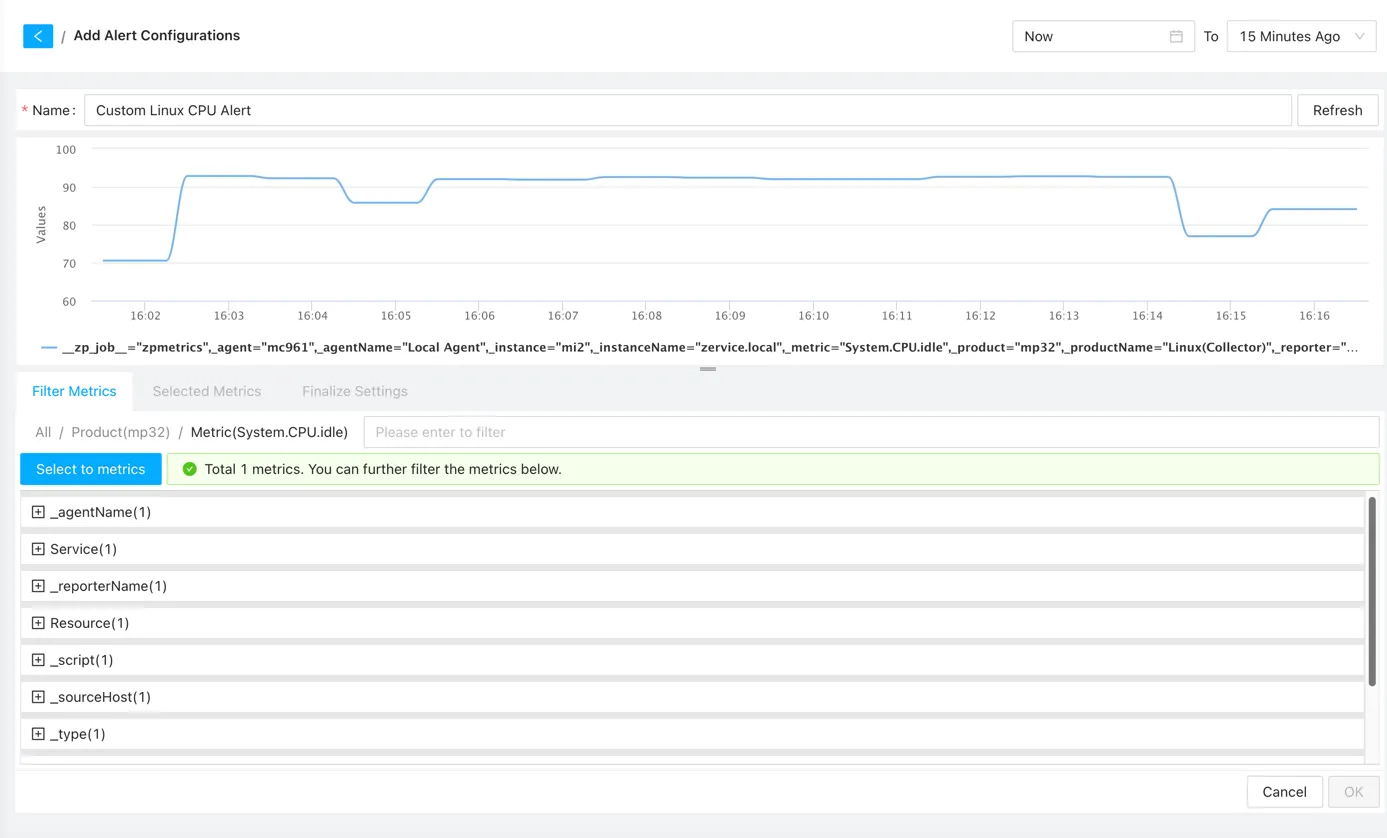
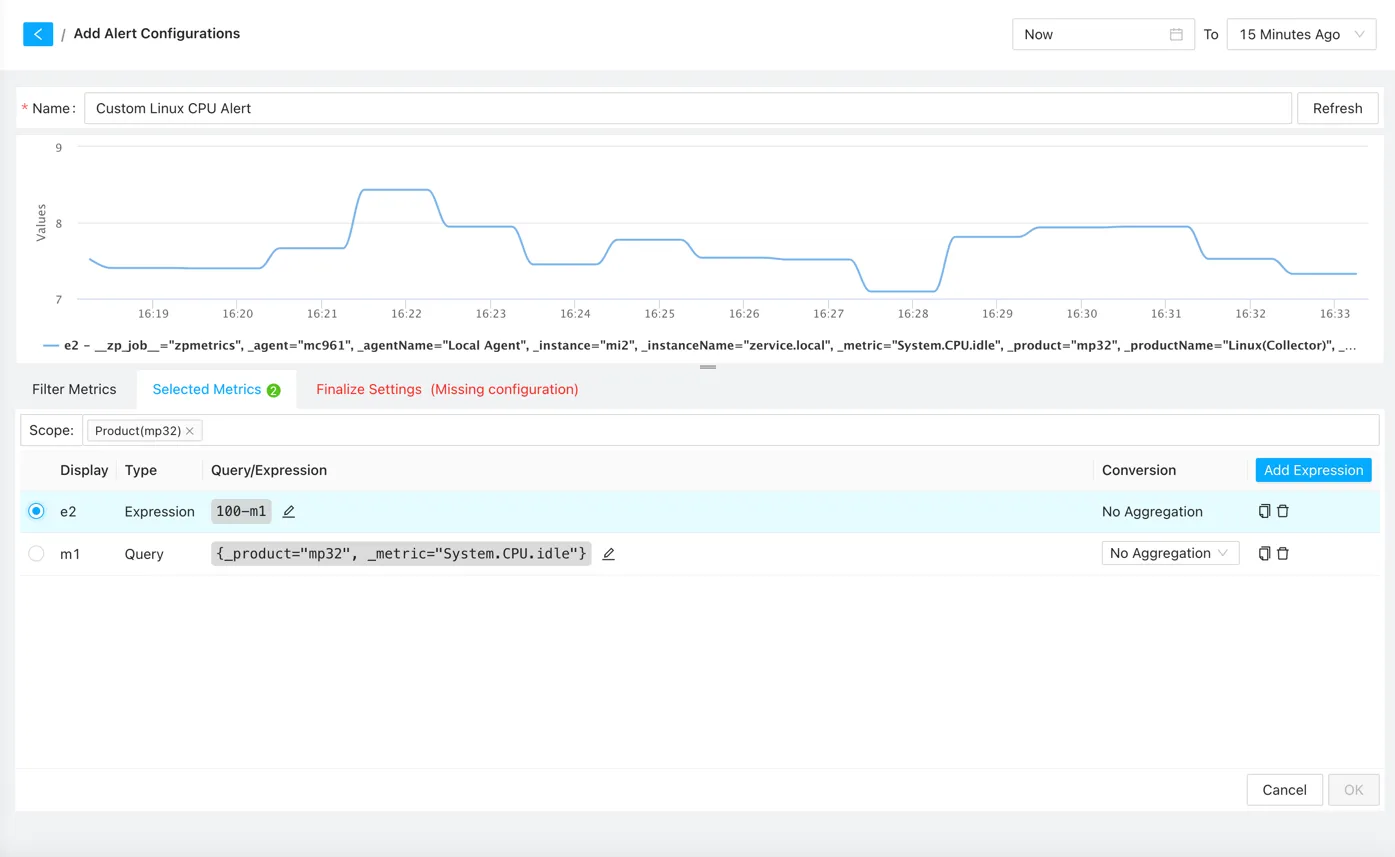
After confirming the metrics, click the Select to metrics button to proceed. Here, you can add more metrics and define calculations. Click Add Expression to input mathematical formulas and select the resulting metric as the alert trigger.
Once confirmed, click the Finalize Settings button to proceed. Key configurations on this screen include:
- Notification: Select a notification delivery chain. Without a delivery chain, the system will generate the alert but won’t send external notifications, meaning you can only view them by logging into the UI.
- Threshold: Set the threshold values for different alert levels (e.g., Warning, Critical). You can also specify the duration the threshold must be exceeded before triggering an alert, and choose whether to trigger alerts for missing data. Note that if threshold ranges overlap, the higher-severity alert takes precedence.
- Description: Provide a description that helps identify the cause of the alert. We recommend using placeholders (such as alert name, level, trigger value, and affected host) to provide context. The default templates include this information, but you can customize them to facilitate quick resolution.
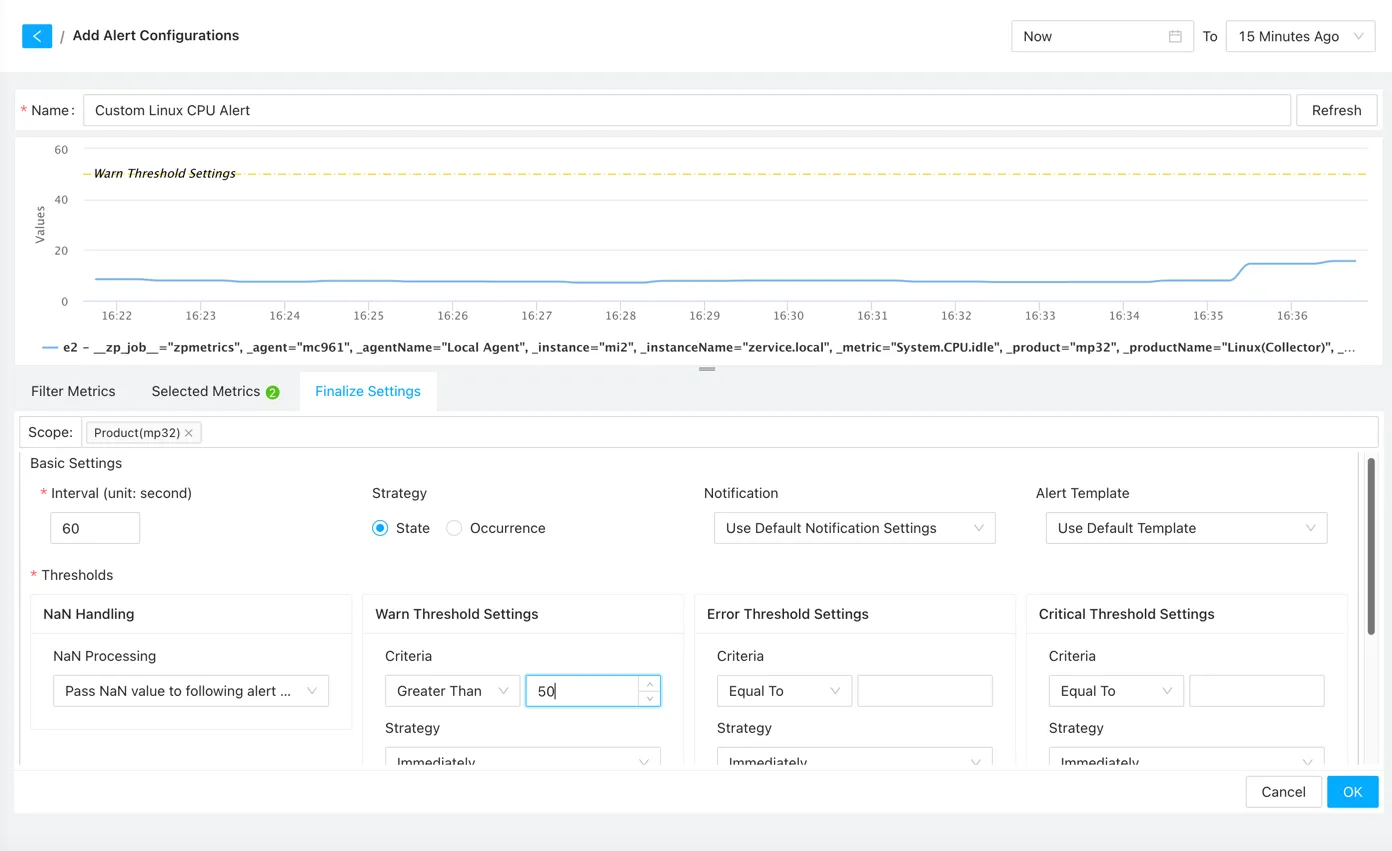
After configuring the alert settings, click the OK button to save the alert rule.
Quick Method
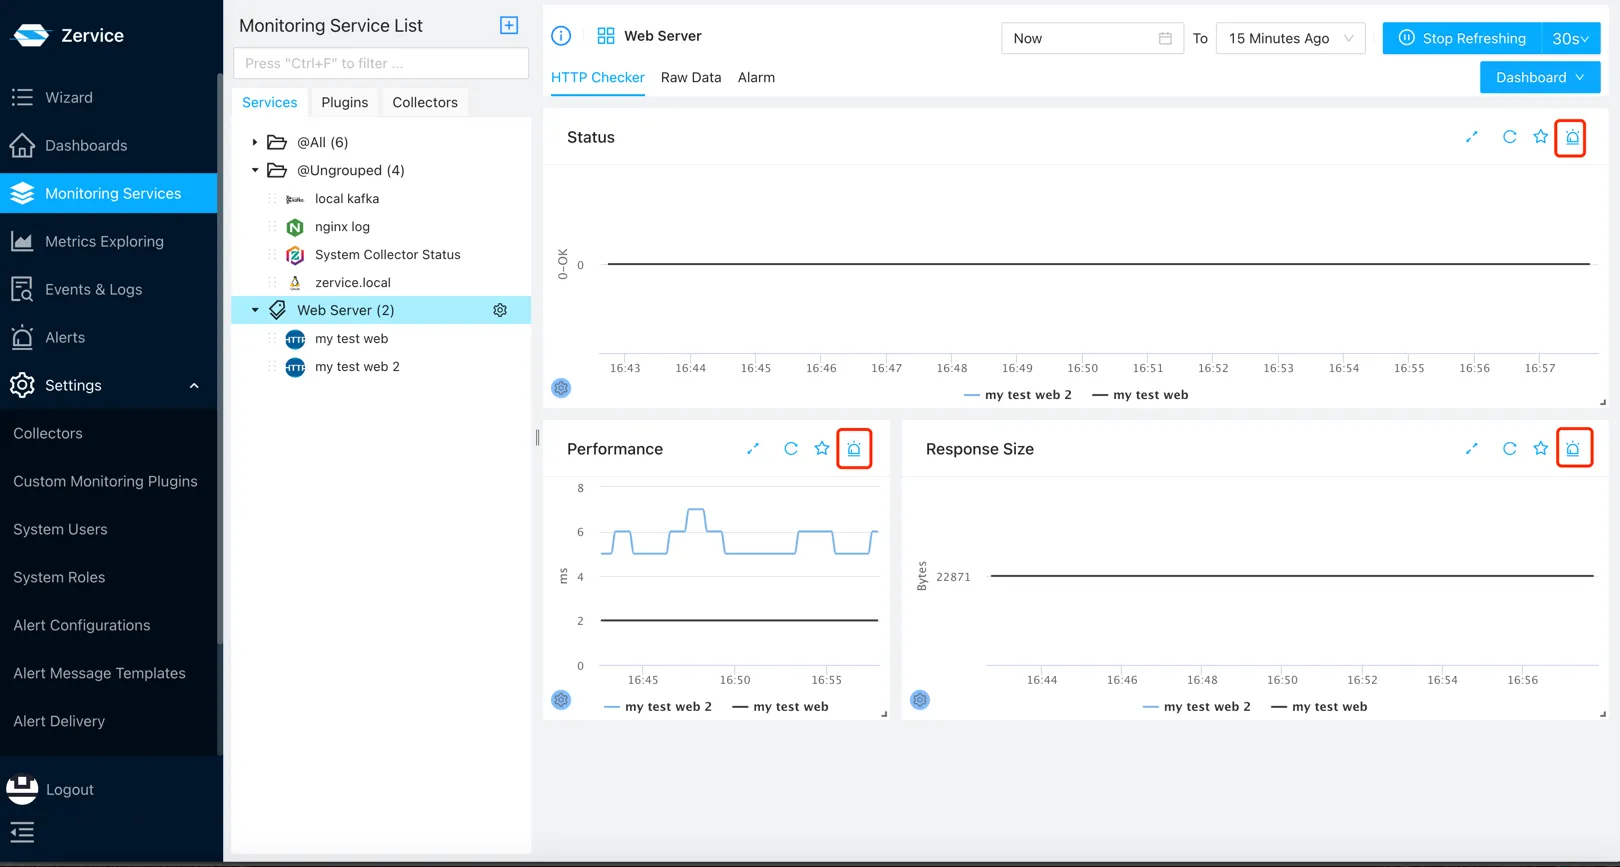
First, navigate to the service page and select Tag, Application, or Service to view the device dashboard. You will notice alert icons on these widgets.
Click the alert icon to open the alert configuration page, where the system will pre-select the widget’s metrics. Click the Finalize Settings button to set the thresholds and notifications directly.
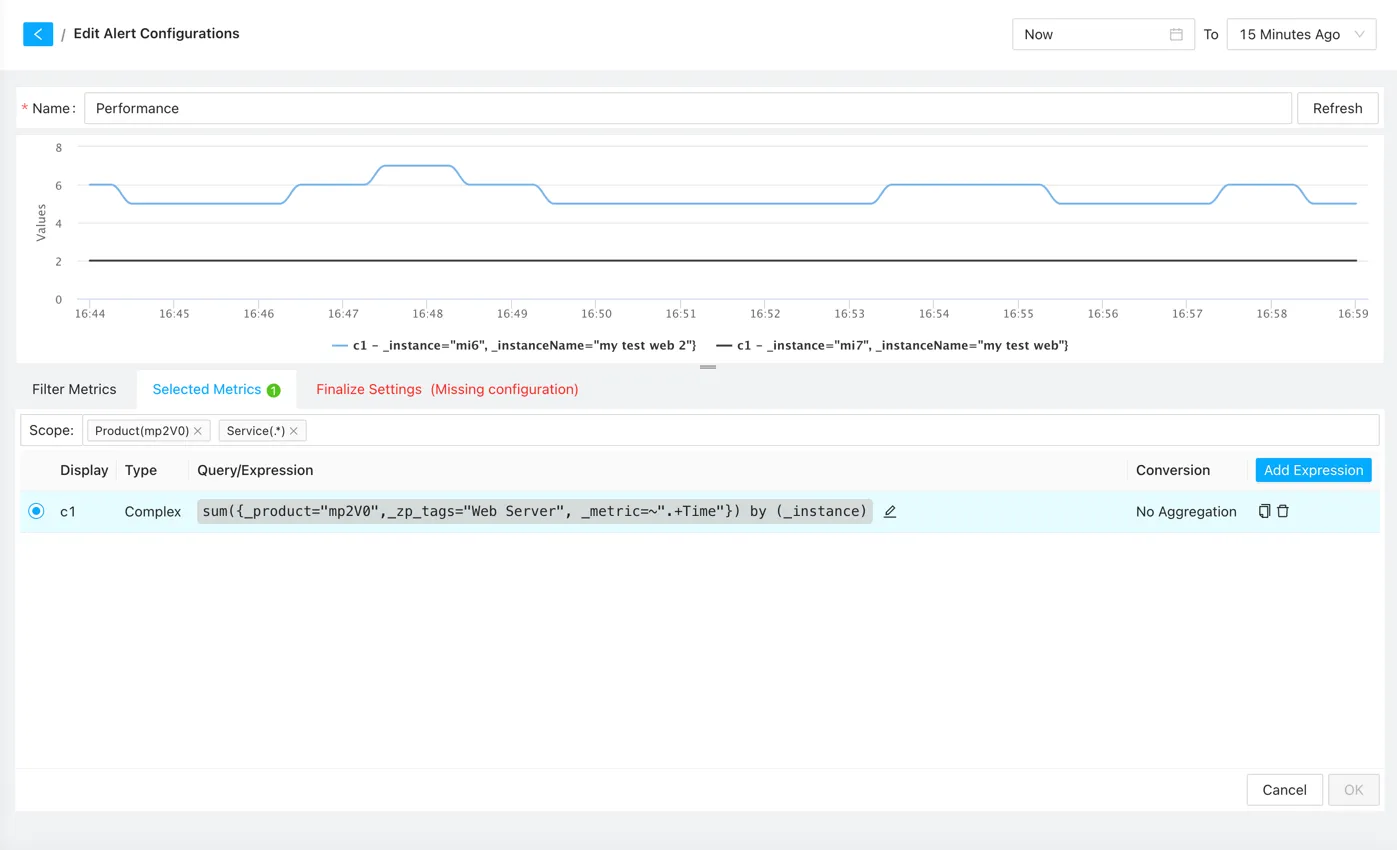
After configuring the settings, click the OK button to save the alert rule.
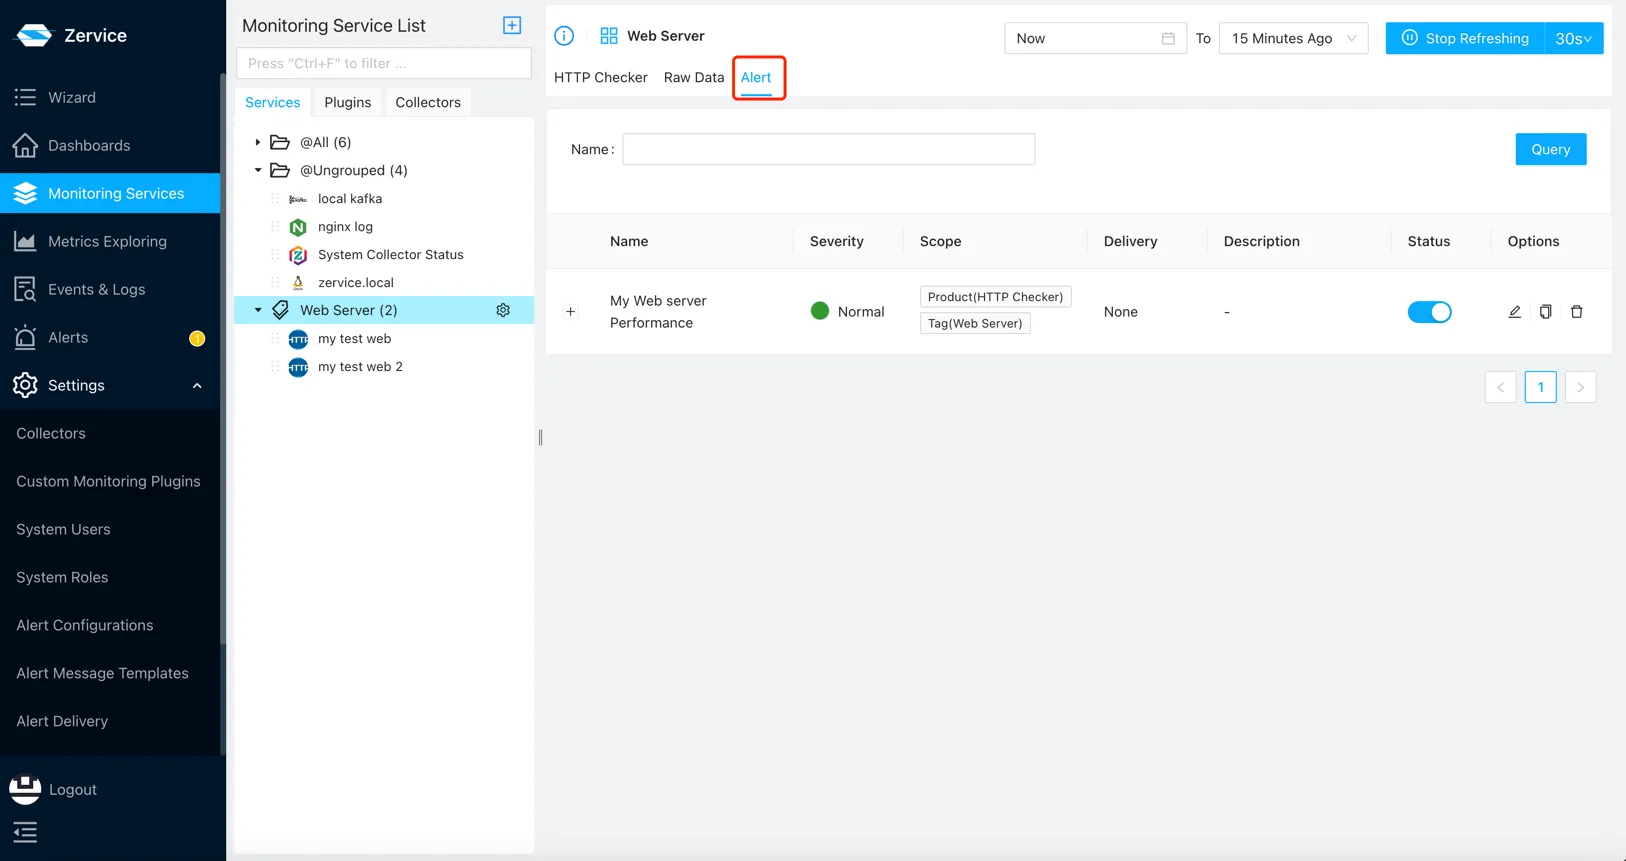
Both creation methods produce standard configurations that can be managed on the Alert Configurations page and viewed on the Alert page of each service. If you do not see a generated alert on the corresponding service page, double-check that the alert configuration scope is set correctly.